
Good evening one and all. I read that Christine Lagarde was out warning the world about the inherent risks in the global economy today. It is all the more comical because she tempered her statement, By saying that 2017 was on track to be the best year of the decade so far.
Well of course it is! 2007 was the best year of the decade before the last collapse happened. 1999 was a fantastic year before the dotcom bubble burst. And I hear that 1928 was a stellar year, choc full of good news and great achievement!
Economies always look great right before the bell tolls! This time is no different!
TOMORROWS RISK EVENTS:
USD: CPI m/m, Core CPI m/m, Retail Sales m/m, Core Retail Sales m/m. EUR: N/A. GBP: N/A. JPY: N/A.
GBPUSD
30 min
4 Hours
Daily

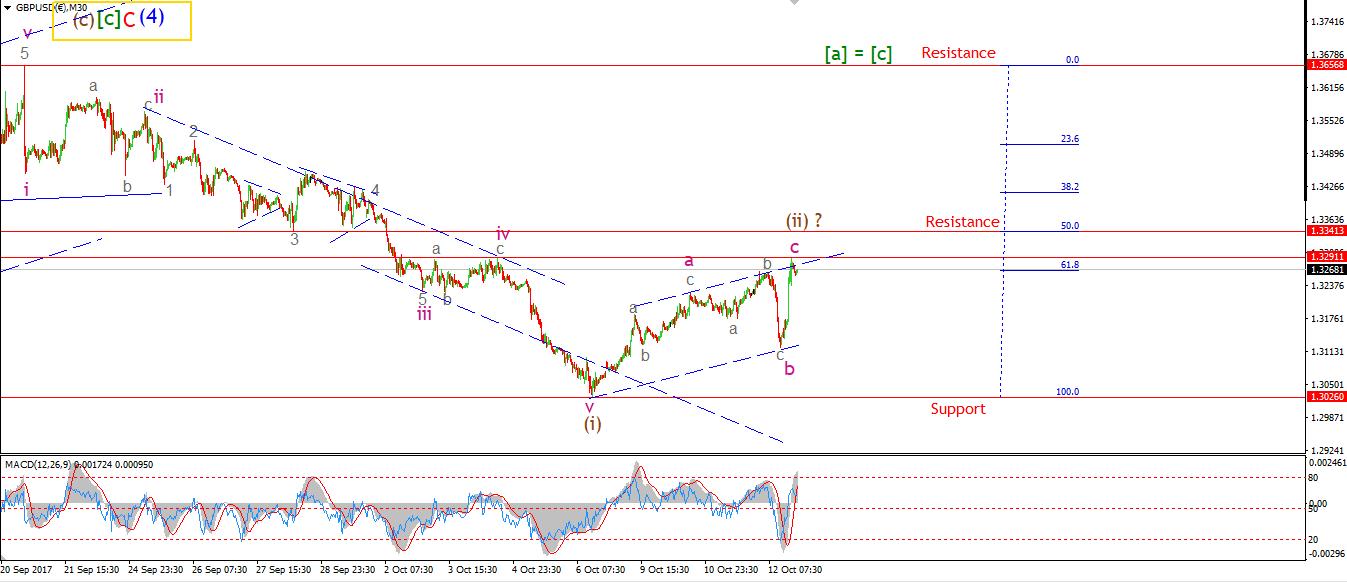
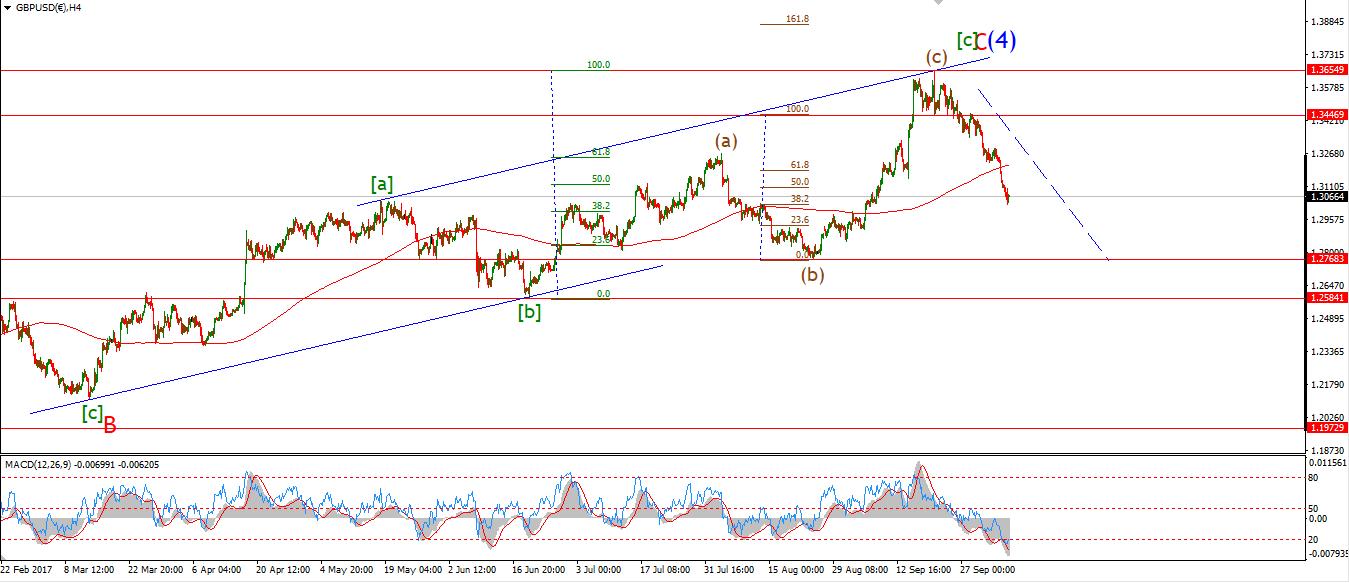
My Bias: short below parity in wave (5). Wave Structure: continuing impulsive structure to the downside in wave (5) Long term wave count: decline in wave (5) blue, below parity
Todays action in cable has necessitated rethink of the corrective rally in wave (ii). The correction is now viewed as a complex flat. With the internal structure taking a 3,3,5 form.
The price rallied hard today into the upper trendline and has cooled off as I write. There is a possibility that this structure is complete now.
If we get an impulsive move down tomorrow to create a lower high, That will be the first sign that wave (iii) down is beginning.
For tomorrow; Watch for a reaction off the 50% retracement level at 1.3340, And a decline in an impulsive fashion.
DOW JONES INDUSTRIALS
30 min
4 Hours
Daily

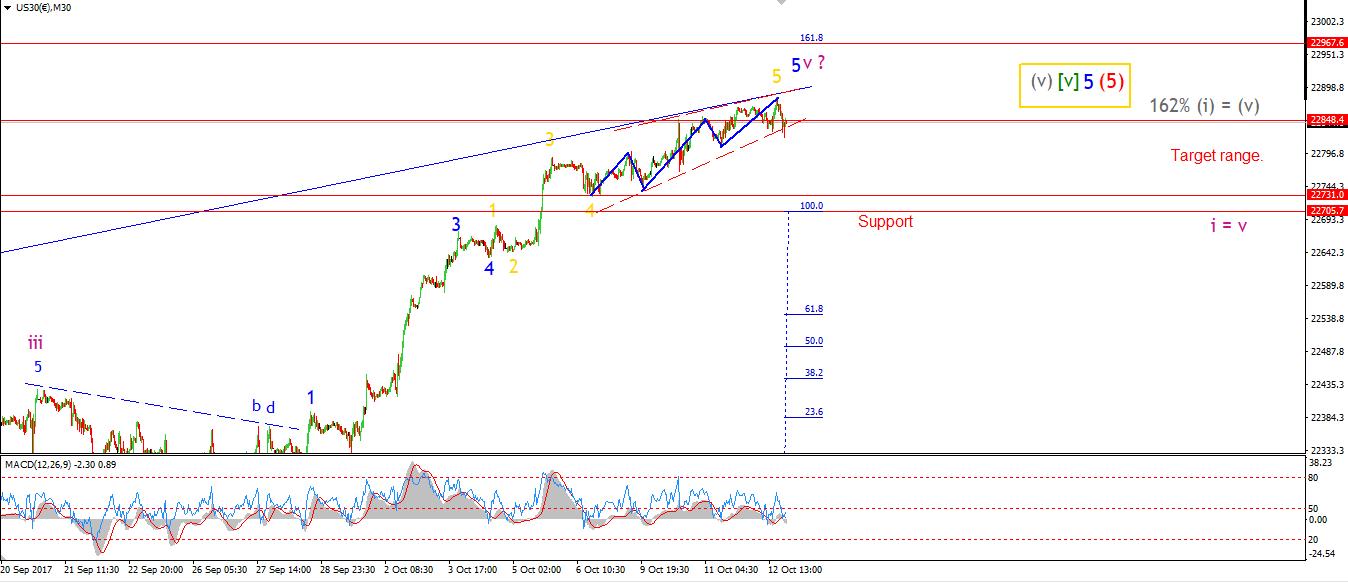
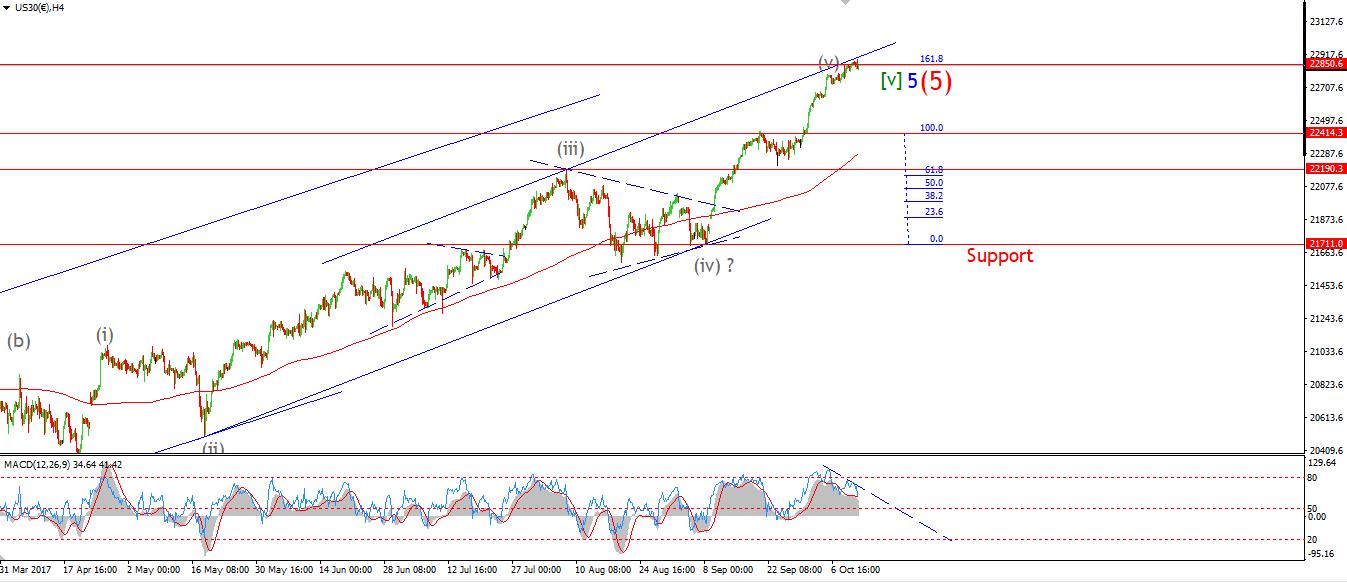
My Bias: market topping process ongoing Wave Structure: Impulsive 5 wave structure, possibly topping in an all time high. Long term wave count: Possibly topping in wave (5)
I have illustrated the ending diagonal idea this evening, Showing the five waves within wave '5' blue and the ending diagonal structure.
This market is so extended, that I have run out of labels!
The price has dropped out of the contracting trendline structure this evening. Could this be the beginning of the end for the stock market? I have to wonder this, given the extended nature of the market right now.
If we begin to see an impulsive structure develop to the downside from here, That will increase the odds that a significant high is in, The 4hr momentum indicators are steadily building a bearish divergence now, And the price has now reached the upper trendline of the larger trend channel on the 4hr chart.
So the bearish signals are most definitely present.
For tomorrow; Watch for an impulse move to the downside, A break below 22731 will increase the odds of a market peak.
GOLD
30 min
4 Hours
Daily
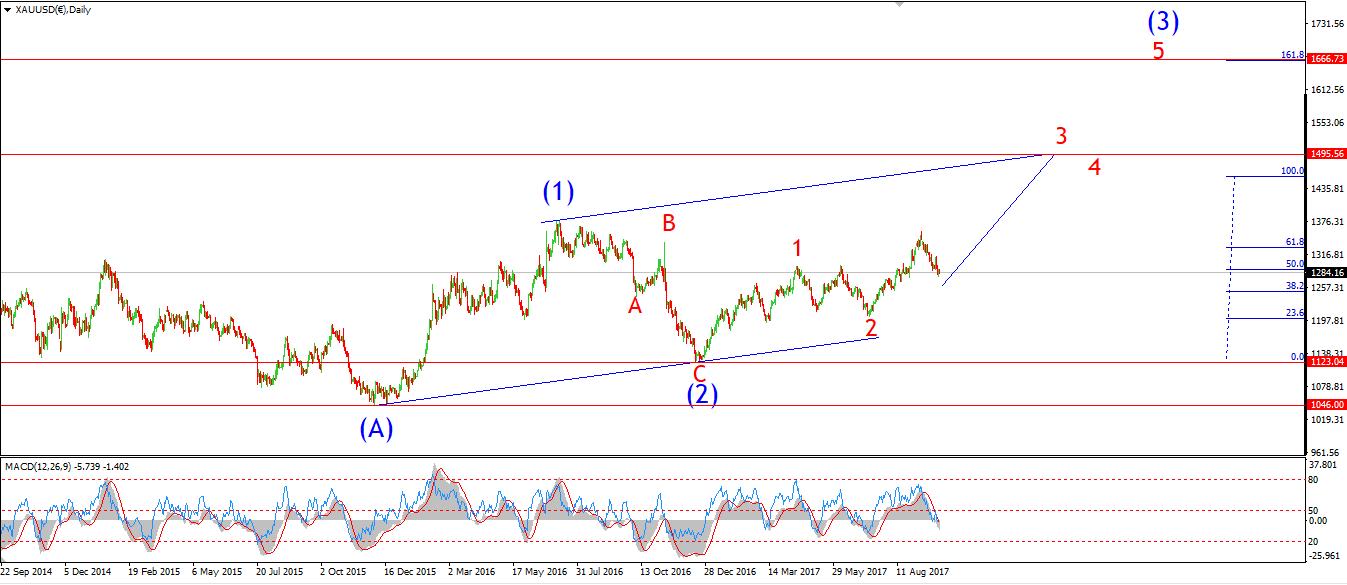
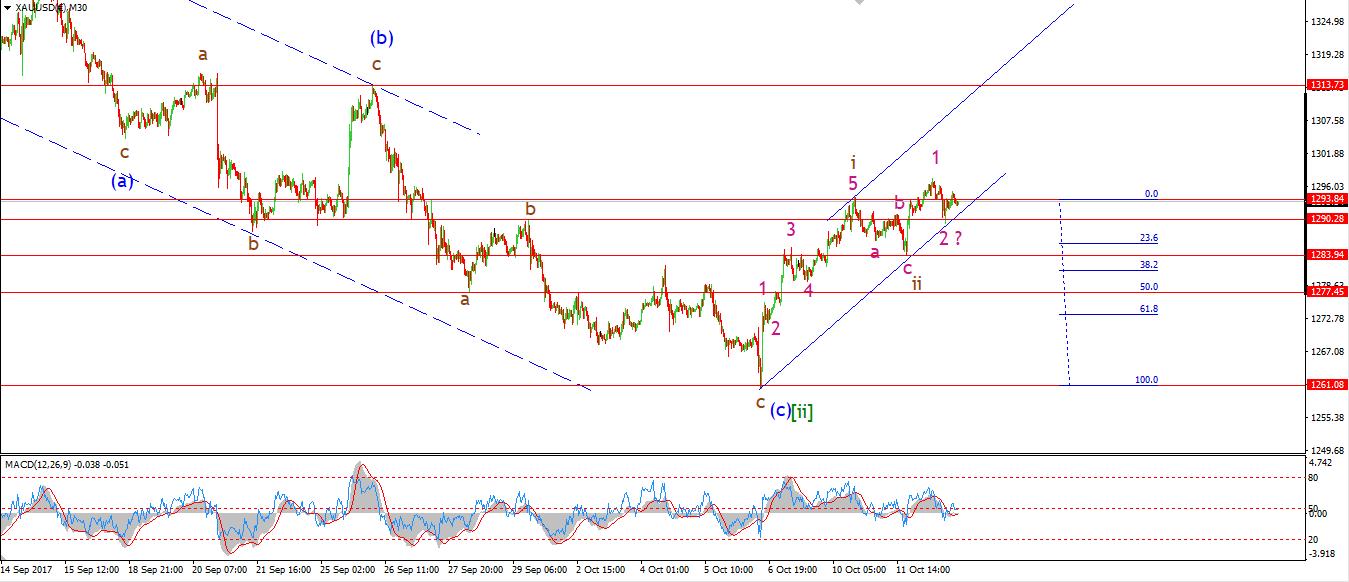
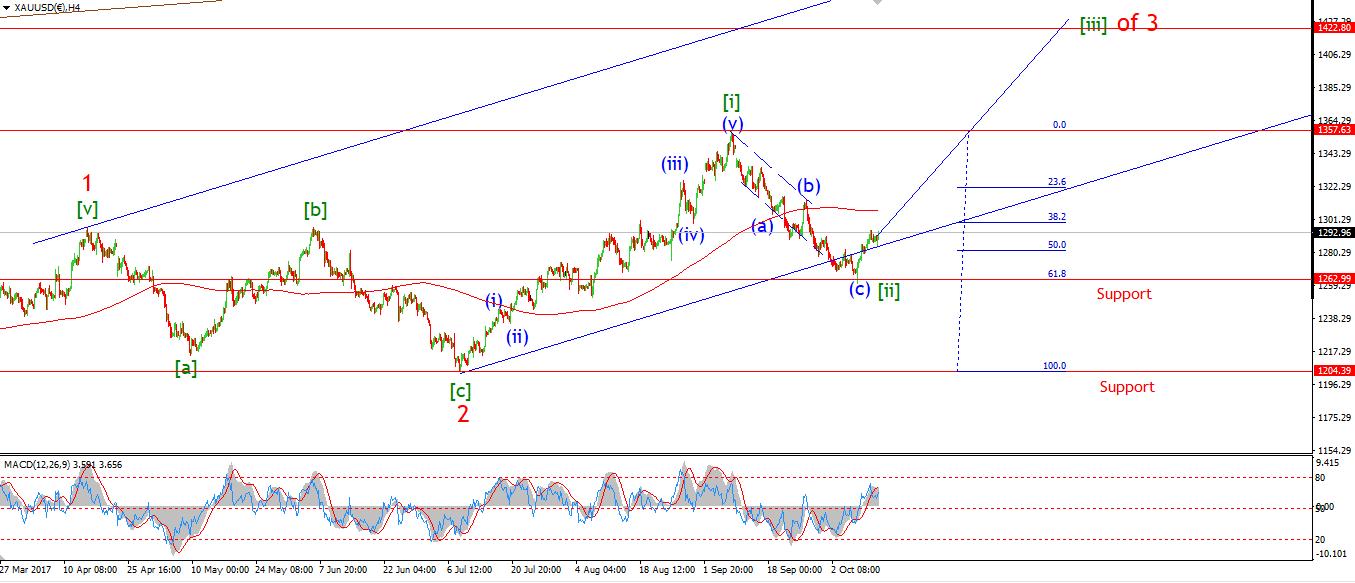
My Bias: Long to a new all time high above 1827. Wave Structure: Impulse structure to a new high. Long term wave count: wave (3) above 1666.
GOLD has now created a higher low above wave 'ii' brown on the short term chart. The wave structure is now primed for a significant rally in wave (iii) of [iii].
To put this in perspective, The target for wave [iii] green lies at about 1500, This is where wave [iii] reaches 161.8% of wave [i] green.
If the price carries above 1313, the previous wave (b), Then we can confirm the price has turned up into wave [iii].
For tomorrow; Watch for 1284.86 to hold and for a rise into the upper trendline on the short term chart. Wave 'iii' should begin to take hold now.
U.S CRUDE OIL
30 min
4 Hours
Daily
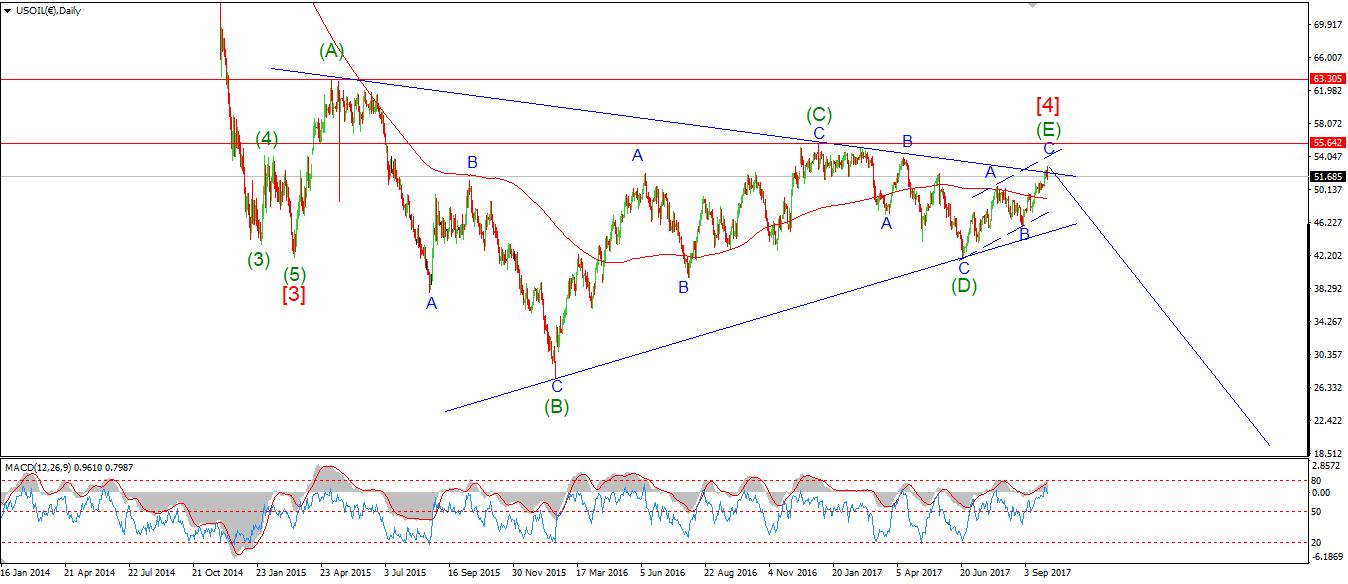
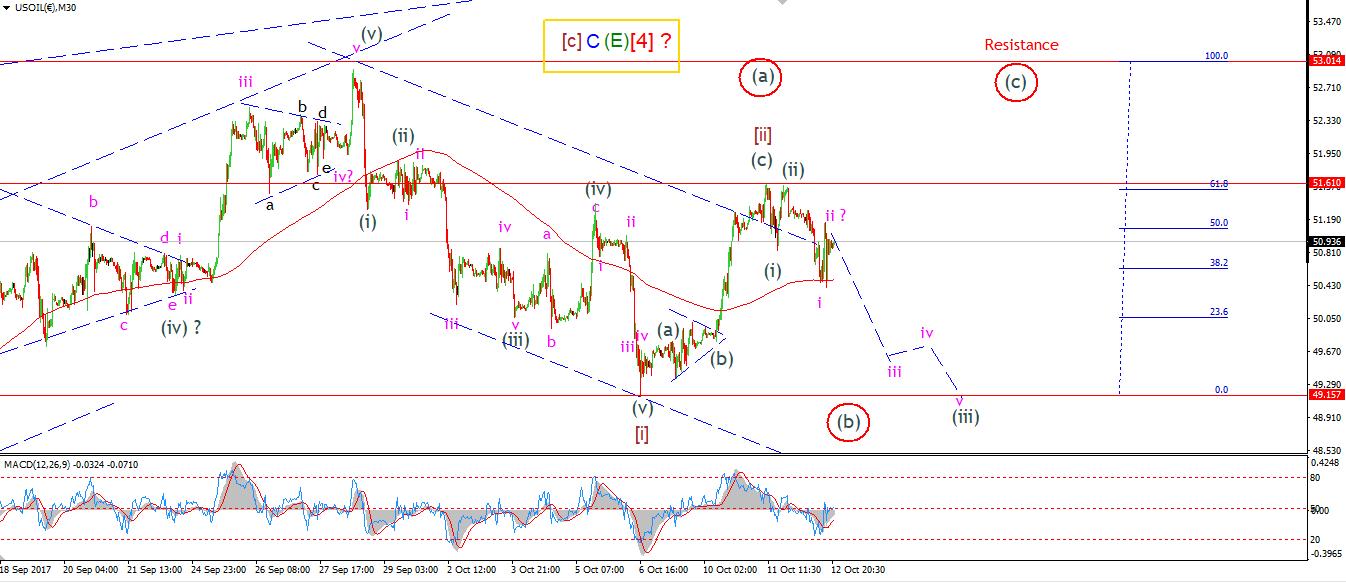
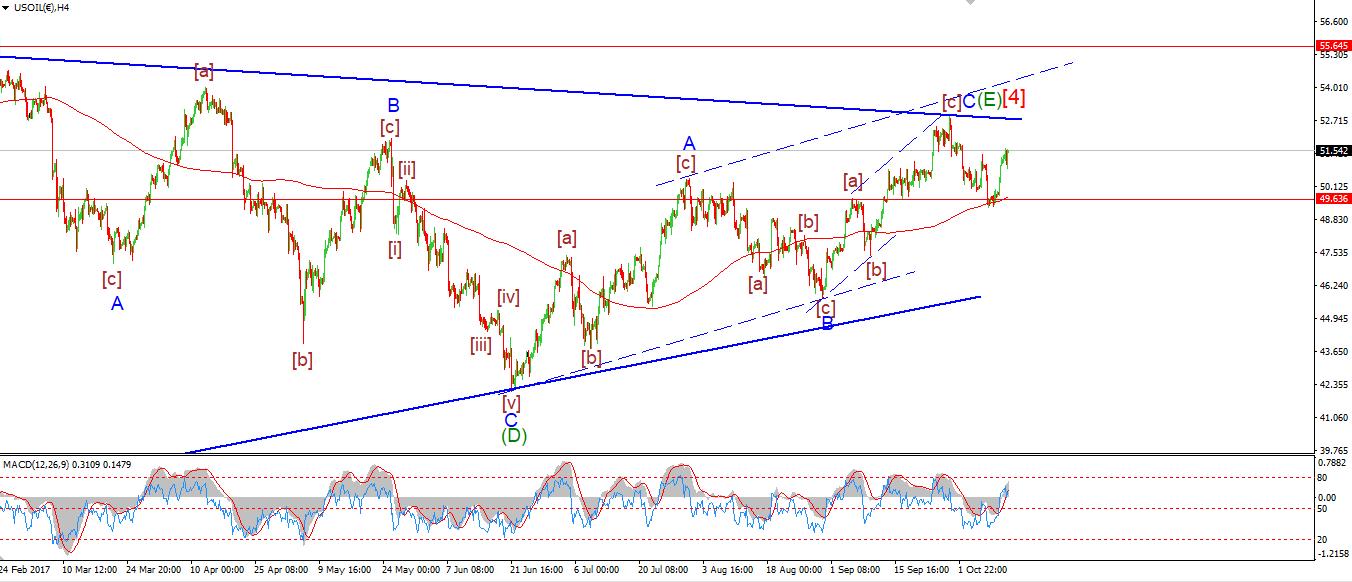
My Bias: topping in a large correction wave [4]. Wave Structure: ZigZag correction to the downside. Long term wave count: Declining in wave 'c' target, below $20
I have shown an alternate wave count on the short term chart which would allow for wave [ii] brown to develop further into a large flat correction.
This alternate wave count might better explain the large rally this week. So if the decline off Wednesdays high does not develop in an impulsive fashion, it will tip the odds in favor of the alternate wave count.
The whipsaw action in the middle of the day does confuse matters slightly for the current wave count, Further declines are called for in order to validate the current wave count.
For tomorrow; Watch for immediate declines in a possible wave 'iii' pink.
Read more by Enda Glynn


