The recent downward price swing in Gold has kept Goldbugs frothing at what they believe is a very unusual and unexplained price function in the face of so much uncertainty throughout the globe. With Turkey, Russia, China and many others experiencing massive economic and currency crisis events, Gold has actually been creeping lower as the US Dollar strengthens. It is almost like a “Twilight Zone” episode for Gold Bulls.
The setup for a gold rally has been in place for over a decade. Much like in 2006 through 2008, the current price and volatility of Gold is simply mundane. For the past two years, Gold has rotated between $1190 and $1360 – within a $180 range. Certainly, Gold traders were able to find some profits within this range, but no breakout trends have been established since early 2016 when the price of Gold changed from Bearish to Bullish and a 31% rally took place driving prices $328.80 higher from the lows.
Our team of researchers, at www.TheTechnicalTraders.com, believe something very interesting may be taking place in Gold right now – almost like a “Deja Vu” of the past. A double setup appears to have taken place recently and we believe the bottom may have already formed in Gold for now.
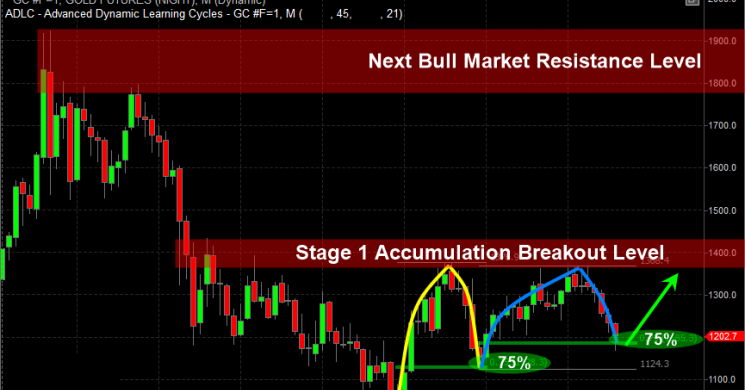
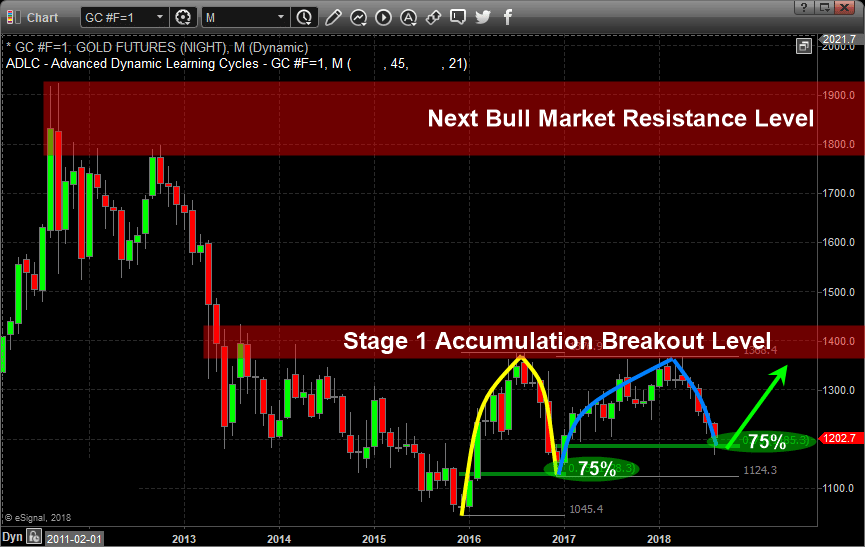
In early 2016 through November 2016 where price rallied 31% then retraced nearly 75% to form the second leg higher. This deep retracement of price was indicative of a wide price rotation before another leg higher pushed back up to near the all-time highs.
From 2017 until now the Gold chart shows another 75% price retracement from recent highs once again. This second 75% retracement could be a massive bottom formation setting up in Gold and could be a huge “wash-out” low price. We believe this unique retracement is indicative of a massive price breakout over the next year or so as the price of gold is forming what Stan Weinstein calls a Stage 1 Accumulation.
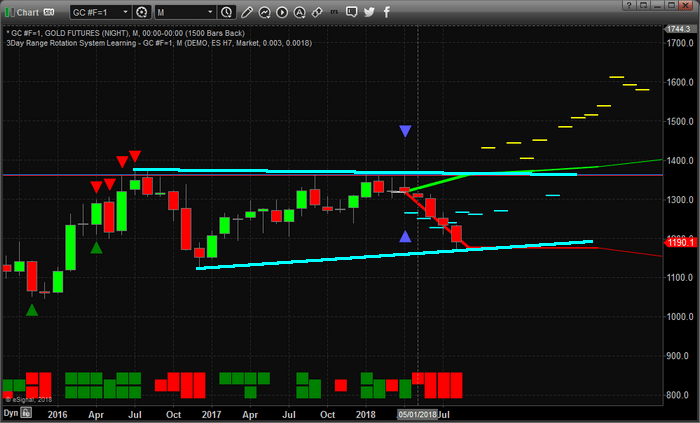
Now, let’s zoom in and take a look at the weekly chart and our Adaptive Dynamic Learning model, the predictive analysis suggests that Gold prices should begin to bottom within the next week or two and begin to climb much higher over the next 3~10+ weeks.
This pattern consists of 12 unique instances of data and suggests that the future upswing will start rather mild for the first 2 weeks, then begin to accelerate as time progresses. It appears we have a strong potential to see prices above $1400 within the next 5~8 weeks or so and you look at the previous chart above, what is the $1400 level? You got it! Resistance, and if price breaks out above $1400 a new bull market would be triggered!
As many of you are aware, Gold is often a move to safety when the global economy begins to show signs of chaos or weakness. We believe the move in the US Dollar will stall and possibly correct as this move takes place. If Gold were to rally while the US Dollar continued to strengthen, you can clearly assume that a flight to safety is taking place and it includes a massive capital migration toward US equities and GOLD. If the rally in gold is seen while the US Dollar weakens or stalls, then we are seeing a move to safety while the currency markets address regional and global currency market issues.
Either way, we expect Gold to begin a new rally higher off of this 75% retracement level to complete the Pennant formation that is currently set up for a Wave 5 upside price expansion. Some of this technical analysis may be over your head as it can be confusing, but you should get the gist of things which is that precious metals should find a bottom and there is the potential that a massive bull market could be on the horizon if price rallies quickly. Be prepared for this move because the Gold shorts will likely be forced to cover their positions within the next few weeks as this move begins to accelerate higher.
Visit www.TheTechnicalTraders.com to learn how we can help you find these types of swings in the major markets. We alert our clients well in advance of these swings and deliver daily video content to all of our members before the market opens each day. Our objective is to make you a better trader and to help you find successful setups to create greater success. Visit our website to learn how we can help you become a better trader today.
Chris Vermeulen Technical Traders Ltd.


