Summary via the Soren K. Group and Marketslant
- The Yen is showing signs of being too strong vs the USD and a reversal is looking likely
- Gold and the Yen have a strong positive correlation to each other when itcomes to their performance vs the USD
- If the Yen reverses, itwill put a damper on Gold's rally
- A pullback in Gold is not unhealthy
- The longer term chart still has Gold on a path to $1370 and $1550 so far.
- Buying dips in Gold above $1245 and $1217 is preferred now given the previous comments
- Bonus: Given the unrest in the Middle and Far East, we also could see a decoupling of the "what's good for the Yen is good for Gold" concept.
Make Sense?
Gold Today:
“The desire for gold is the most universal and deeply rooted commercial instinct of the human race.” So said Gerald M. Loeb, founding partner of Wall Street brokerage E.F. Hutton & Co. and “the most quoted man on Wall Street” according to Forbes, in his 1935 book The Battle for Investment Survival.

Latest prices HERE
And here is Grant's Interest Rate Observer on the 6 year bear breakout chart making the rounds.
Spot gold rose to its highest levels since November near $1,295 per ounce, good for a 13% gain so far in 2017.
In so doing, the yellow metal broke a technical downtrend that has been in place since its September 2011 peak of $1,900 per ounce, according to Sheba Jafari of Goldman Sachs. Still, true believers don’t have too much to be excited about as yet, gold’s weekly average price over the past five years of about $1,314 per ounce is 1.5% higher than current levels.
The pep in the yellow metal may be evidence of market fear rather than reflationary exuberance. The Chinese Gold and Silver Society Exchange expects 2017 mainland gold imports to increase by 50% from the prior year, amidst increased safe haven demand. Likewise, the Japanese yen sits at its strongest level against the greenback in nearly six weeks in another sign of retrenching risk appetite.
Stateside, the spread between two- and ten-year U.S. Treasury note yields has narrowed to around 85 basis points, its lowest since September: Steepness, or lack thereof in the Treasury curve, has historically signified market expectations for economic growth.
The Chart in Question:

So what is the deal?
First the Bad News: USDJPY on the verge of another big move and that is bad for Gold
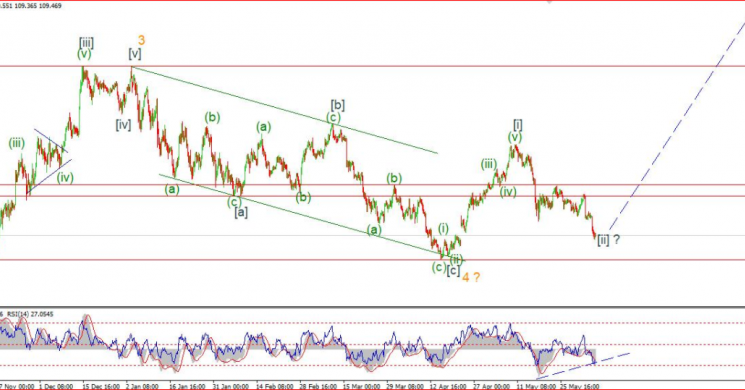
Background: The chart below shows a rally in the YEN as meaning it takes less YEN to buy a USD. It shows the parallel between Yen buying strength and Gold buying strength. Gold and the JPY share a high positive correlation when it comes to their relationship to the USD. In fact, more so than any other major paper currency last we checked.

We wrote the following last week as one possible explanation of the high correlation between the YEN and Gold.
There are several potential reasons for the eerie parallel between JPY and Gold. One simple one is this. In Asia, the JPY is viewed as the most stable regional currency. The Yen is viewed as the USD of the far east. So when Chinese and other Asian players seek safety, they buy Gold and Yen as well as USD (especially) if the crisis is EU based. We feel as the Asian Cartel picks up more strength and the USD Petrodollar becomes less powerful, this JPY/ Gold positive correlation will strengthen more.
Read more from that post: Gold Ready to Rocket
But now the Yen May be Poised to Weaken vs the USD
Now it seems the YEN is poised for a big move; specifically a weakening vs the USD. The wave counts are calling for a possible numerical rally in the USD/JPY. It means the yen may now weaken vs.the USD. If that is true, then Gold longs should take note. Gold could pull back.
That said, nothing here suggests a Gold pullback is not a buy. Just that if the Yen chart rallies (weakens vs.the USD), one leg of Gold's rally table will be kicked out. The EW charts below imply that JPy above 110 and Gold may not hold.
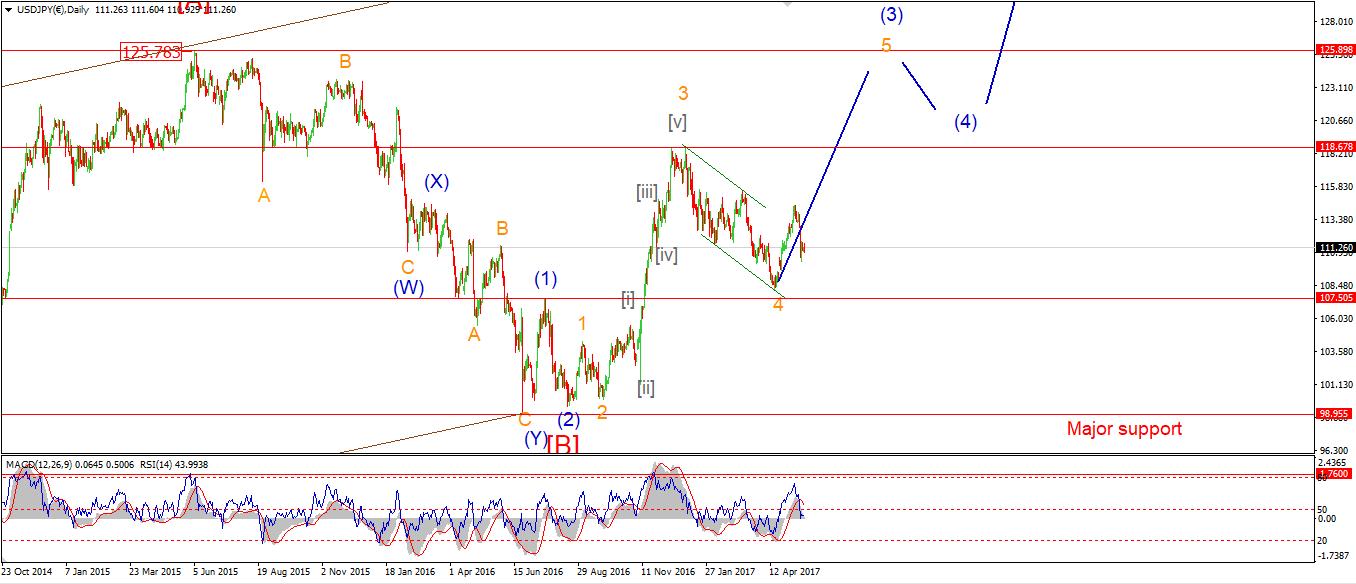
The Yen is oversold numerically at 109 (overly strong vs the USD). The call here is for a possible reversal which would mean a numerical rally in the Yen to potentially 136. This is a weakening vs.the USD. Remember our chart at top shows that a rally in the YEN means a lower numerical number. The charts to follow are inverted. The analysis below is solid. Our only caveat is that picking tops and bottoms with EW is not easy. Oversold can remain this way for some time. Got it?
The Good News: Gold's Rally May be Tip of Iceberg
Since calling the low in wave (ii) blue at 1214, the price is now up $80 dollars! [Edit - indeed, not an easy feat in EW] That's not a bad haul in itself, but I think its just the tip of the iceberg for whats to come here.
We've only Just Begun?
What do the chart tea leaves tell us?
ELLIOT WAVE ANALYSIS
Via Bullwaves.org
USDJPY
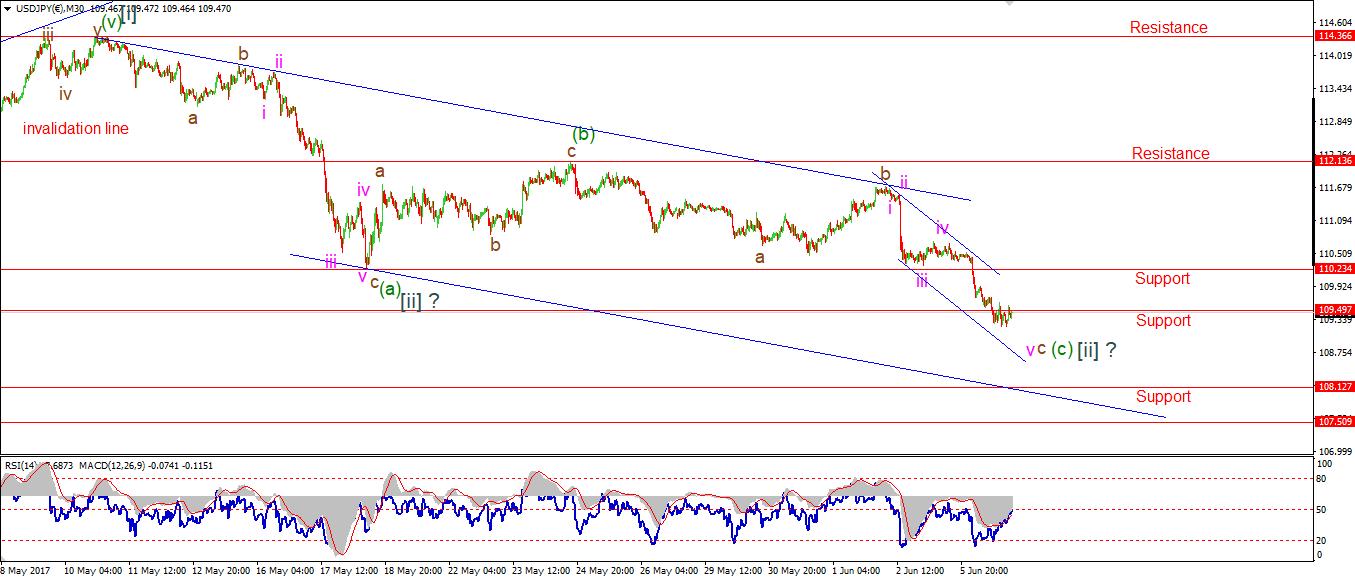
My Bias: LONG Wave Structure: rally in wave [C] Long term wave count: wave [C] is underway, upside to above 136.00 Important risk events: JPY: Final GDP q/q. USD: Crude Oil Inventories.
The price declined again today as called for by last nights wave count. The target at 10940 was met, todays low so far reached 109.22. The declining trend channel suggests one more decline to meet the line once more. That could happen at about 108.70, at which point the price would be perilously close to the lower invalidation line at 108.127.
At the moment we have a significant bullish divergence evident in MACD on the 4hr chart. This is a setup very similar to early April which yielded a 600 point rally! The wave count is now calling for another significant rally in wave [iii] grey. And the price is sitting at a higher low with extreme oversold levels on display. We are on the verge of a big move here if the wave count proves correct.
For tomorrow, watch for signs of a turn up again. A break of resistance at 110.23 again will be the first sign that the rally has begun.
30 min
4 Hours

Daily
GOLD
Let's take a look at Enda's Elliot Wave Update written last night. And it is still spot on
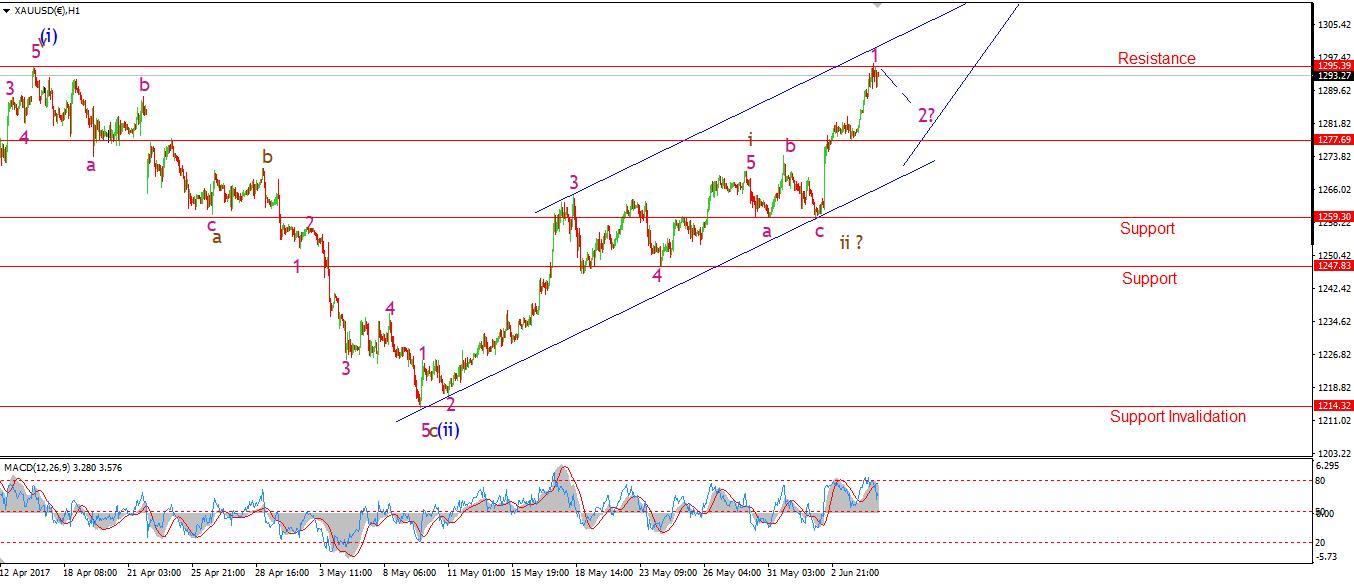
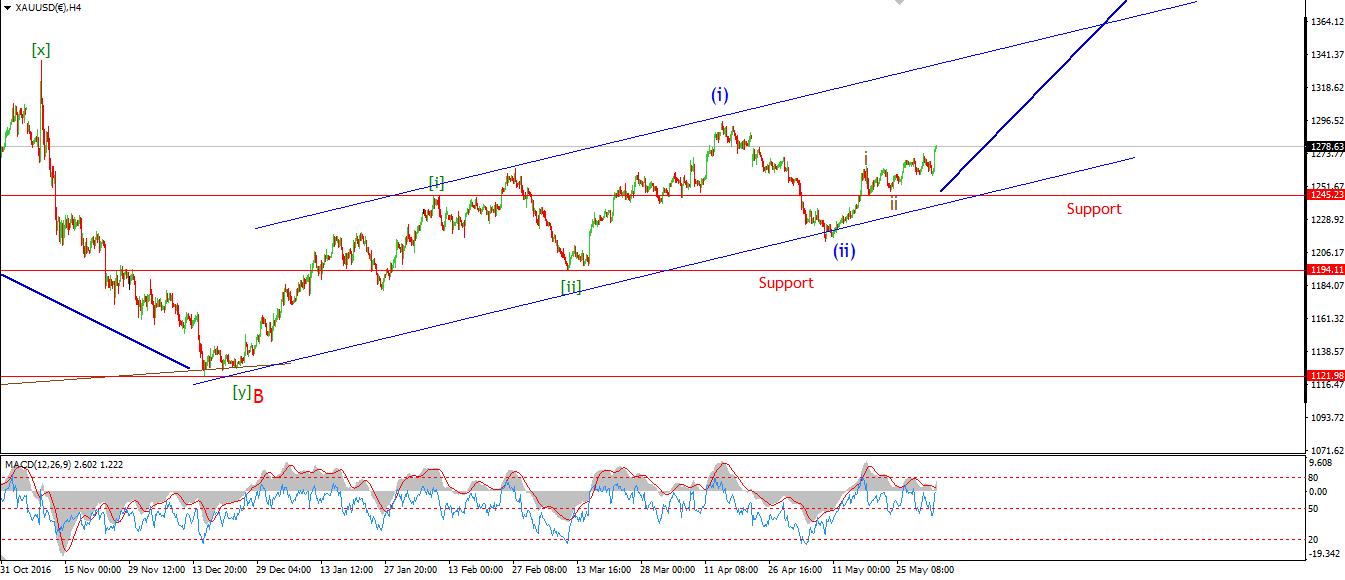
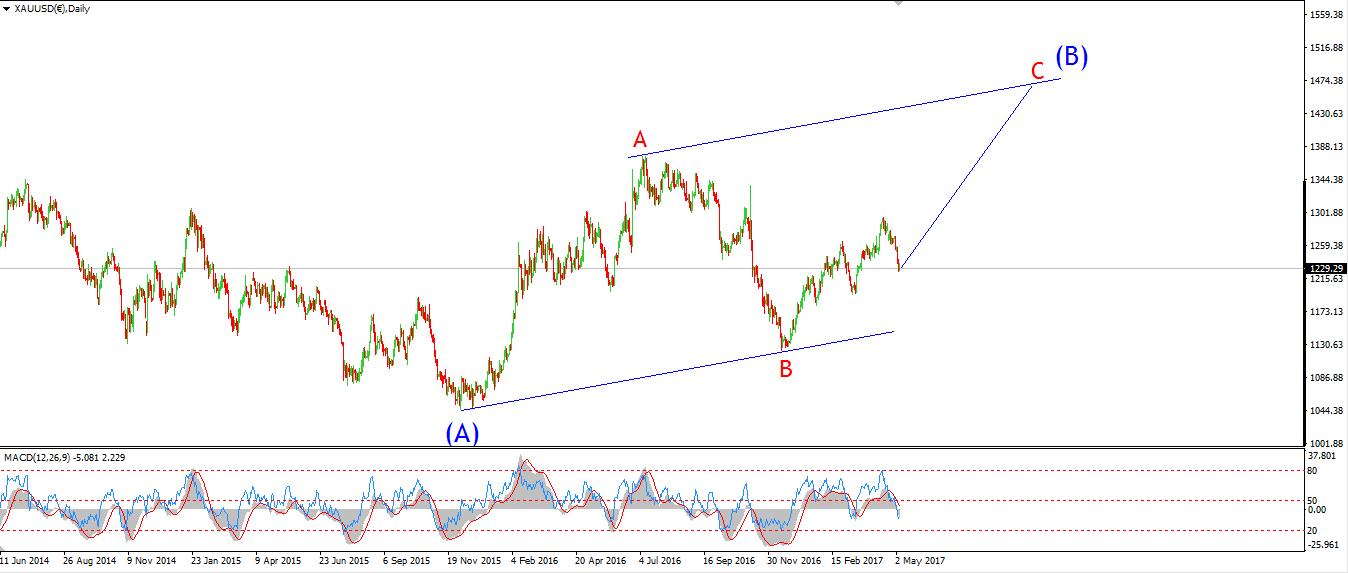
My Bias: Long towards 1550 Wave Structure: ZigZag correction to the upside. Long term wave count: Topping in wave (B) at 1550 Important risk events: USD: Crude Oil Inventories.
Today's further rally in GOLD has bolstered the idea that wave 'iii' brown is underway. I have altered the short term count to show today's high as the high of wave '1' pink.
Since calling the low in wave (ii) blue at 1214, the price is now up $80 dollars! [Edit - indeed, not an easy feat in EW] That's not a bad haul in itself, but I think its just the tip of the iceberg for whats to come here.
Now the price has reached the upper trendline of the rising trend channel, the price should begin to use that upper line as support rather that resistance. A minor correction in wave '2' pink i now called for, but the lows at 1277 should support the rally. A further break of today's high will signal wave '3' pink is underway.
30 min
4 Hours
Daily
DOW JONES INDUSTRIALS
30 min
4 Hours
Daily
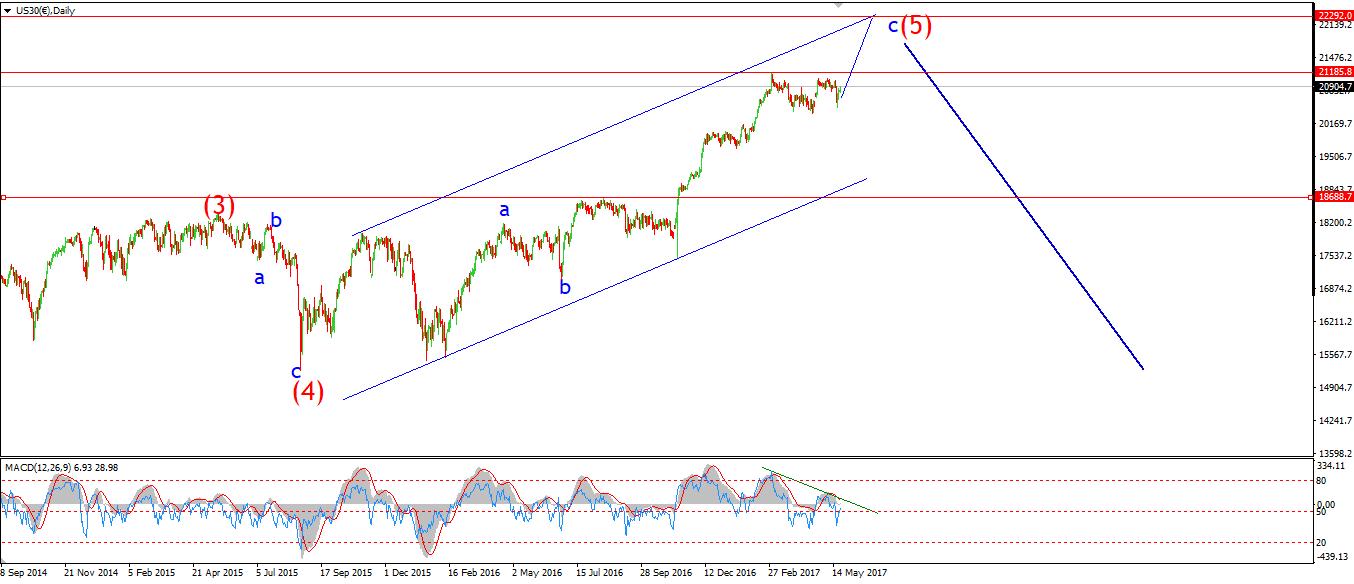
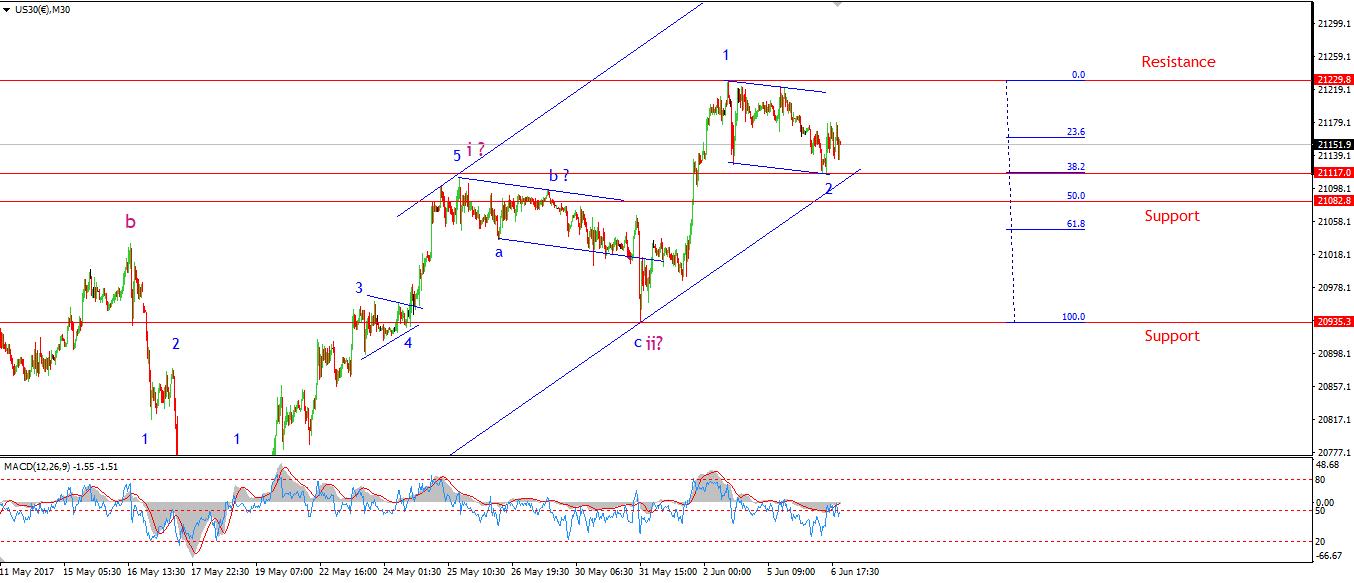
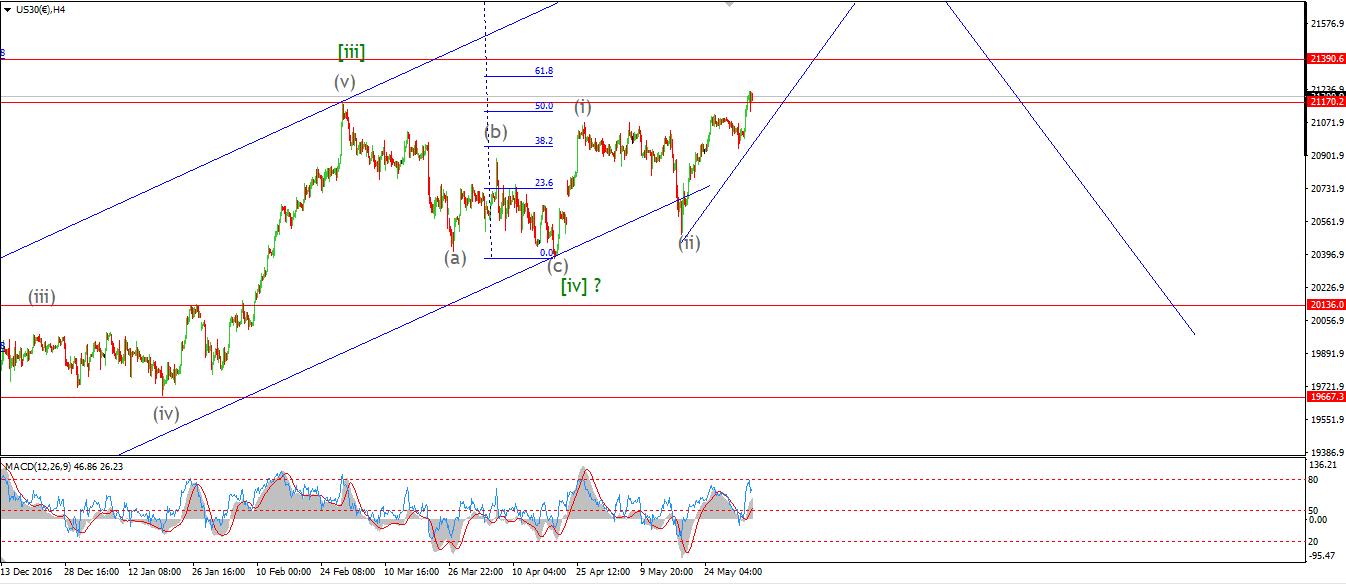
My Bias: market topping process ongoing Wave Structure: Impulsive 5 wave structure, possibly topping in an all time high. Long term wave count: Topping in wave (5) Important risk events: USD: Crude Oil Inventories.
It looks like wave '2' blue could be complete at todays lows. The declines today look corrective and fit well with last nights wave count. The target for wave '2' was set at 21116, and the low of the day reached 21117! 21117 is also the Fibonacci 38.2% retracement level, so the chances of a new rally in wave '3' are quite good now.
The price has bounced in an impulsive fashion off that low, wave '3' may already be underway. For tomorrow, watch that low at 21117, it should hold from here. But any break will simply mean wave '2' is extending in a more complex wave form. A break of today's high at 21178 will add weight to the idea that wave '3' is underway.
Read more by Enda Glynn
Read more by Soren K.Group


