Stocks extended their short-term losses on Wednesday, as they retraced most of last week's Friday's rally. The broad stock market failed to continue its rebound from February 9 low despite technology stocks reaching new record highs. Investors' sentiment worsened again following economic news, trade war fears. There are still two possible future scenarios. Or maybe three, but the third one is the worst.
The main U.S. stock market indexes extended their Tuesday's losses, as they closed 0.2-1.0% lower yesterday. The S&P 500 index lost 0.6% following Tuesday's bounce off resistance level at 2,800. However, it remained at the support level of last Friday's daily gap up. It currently trades 4.6% below January 26 record high of 2,872.87. The Dow Jones Industrial Average was relatively weaker than the broad stock market, as it lost 1.0% and the technology Nasdaq Composite lost just 0.2%.
The nearest important level of resistance of the S&P 500 index is now at around 2,775-2,780, marked by yesterday's daily high. The next resistance level is at 2,790-2,800, marked by short-term local highs. On the other hand, support level is at 2,740-2,750, marked by Friday's daily gap up of 2,740.45-2,751.54. The next level of support is at 2,700-2,720, among others.
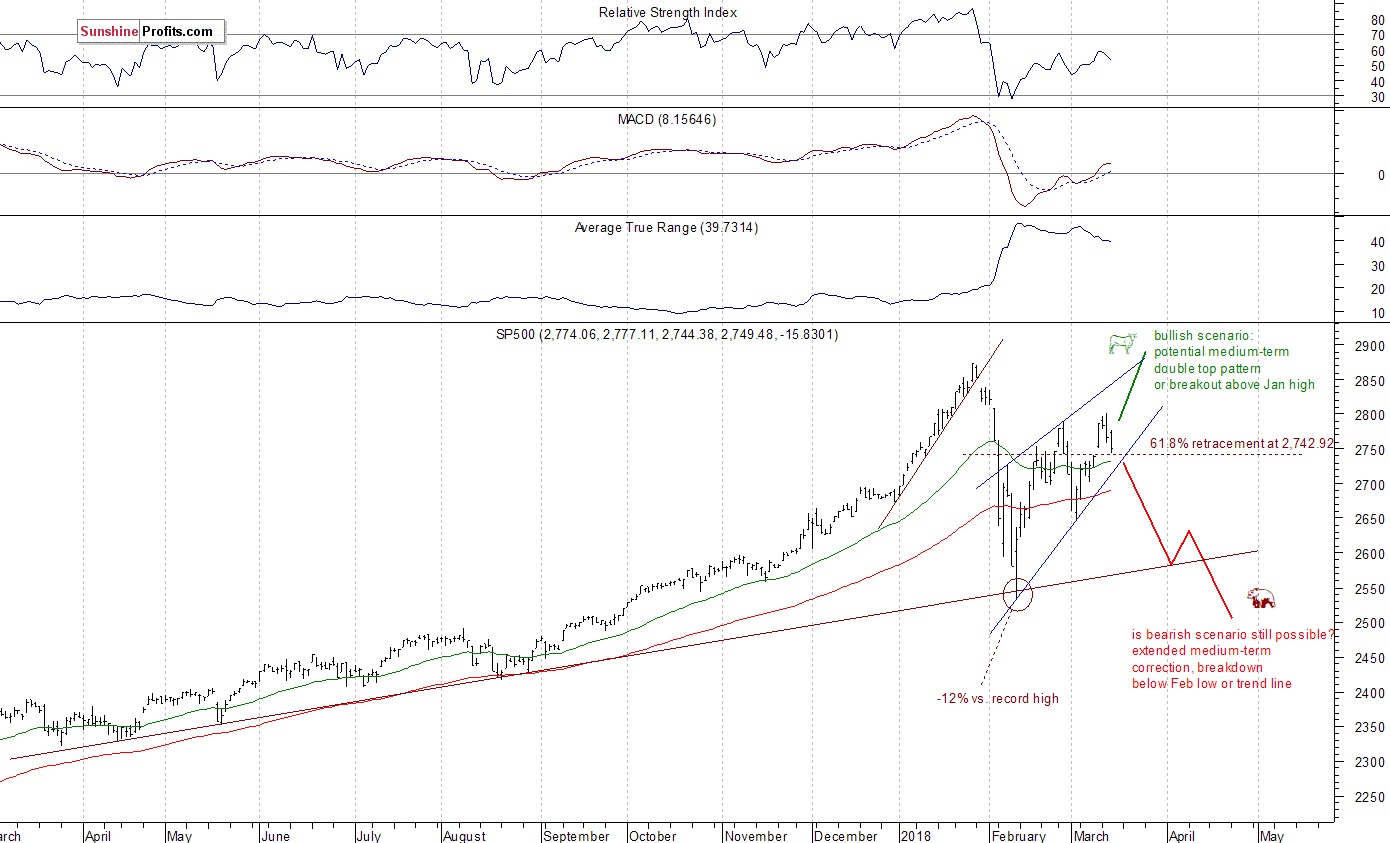
The S&P 500 index reached its record high on January 26. It broke below month-long upward trend line, as it confirmed uptrend's reversal. Then the broad stock market gauge retraced all of its January rally and continued lower. The index extended its downtrend on February 9, as it was almost 12% below the late January record high. We can see that stocks reversed their medium-term upward course following whole retracement of January euphoria rally. Then the market bounced off its almost year-long medium-term upward trend line, and it retraced more than 61.8% of the sell-off within a few days of trading. Is this just an upward correction or uptrend leading to new all-time highs? The market seems to be in the middle of two possible future scenarios. The bearish case leads us to February low or lower after breaking below medium-term upward trend line, and the bullish one means potential double top pattern or breakout above the late January high. However, the most likely scenario may be that stocks go sideways for a while, and it would be the worst future scenario:
Uncertainty Following Move Down
The index futures contracts trade 0.1% higher vs. their yesterday's closing prices, so expectations before the opening of today's trading session are slightly positive. The European stock market indexes have gained 0.2-0.3% so far. Investors will wait for some economic data announcements: Empire State Manufacturing Index, Philly Fed Manufacturing Index, Initial Claims at 8:30 a.m., NAHB Housing Market Index at 10:00 a.m. Will yesterday's move down continue? The S&P 500 index reached its Friday's daily gap up, which may act as a short-term support level. If the market breaks lower, it could continue towards the level of 2,700. But for now, it looks like a downward correction. So, we will likely see more fluctuations above support level of 2,750, and below resistance level of 2,800.
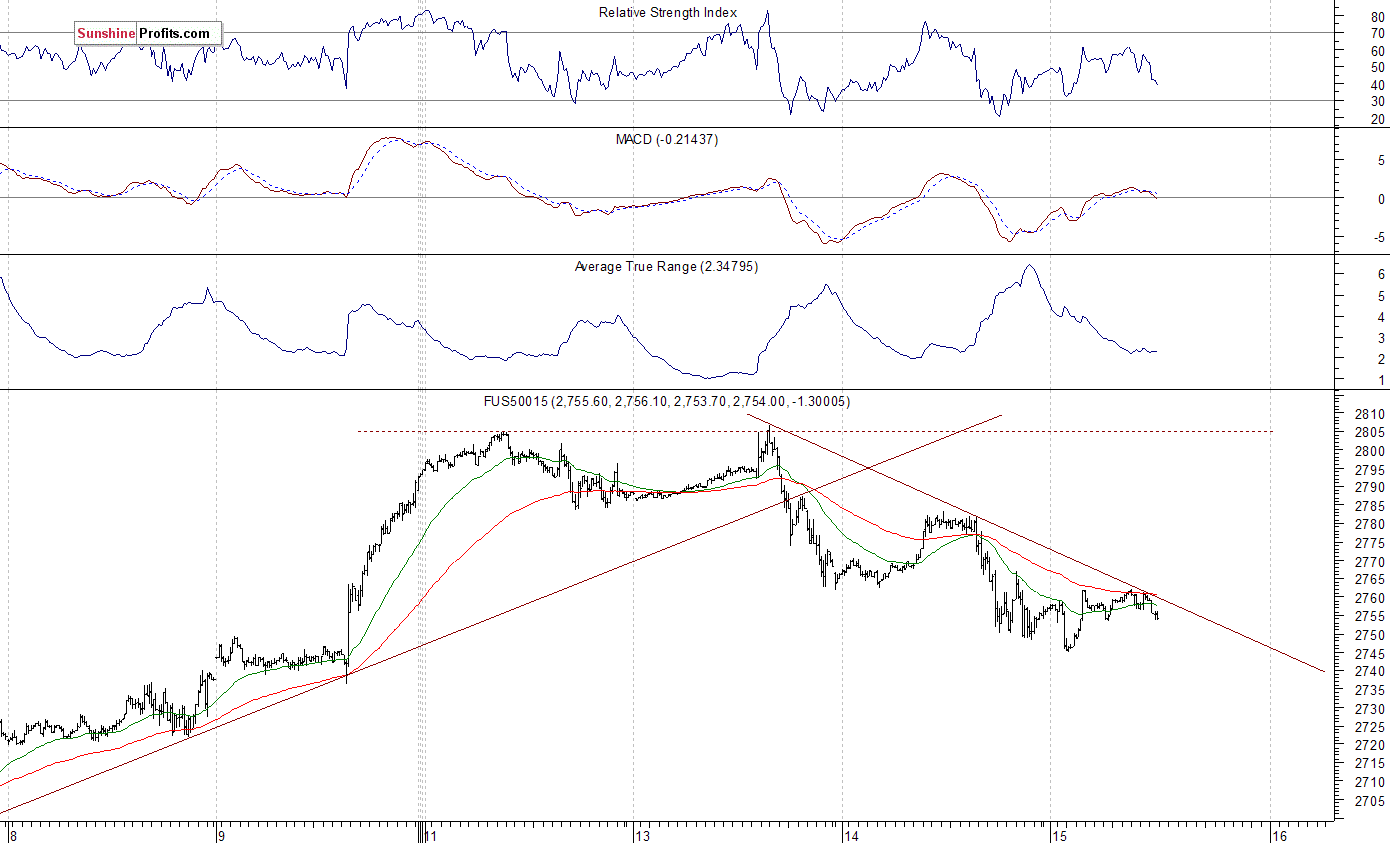
The S&P 500 futures contract trades within an intraday consolidation, as it retraces some of its overnight move down. The nearest important level of support is at around 2,745-2,750, marked by local low, among others. On the other hand, resistance level is at 2,775-2,785, marked by yesterday's local high. The futures contract is below its short-term downward trend line, as we can see on the 15-minute chart:
Nasdaq Remains Above 7,000 Mark
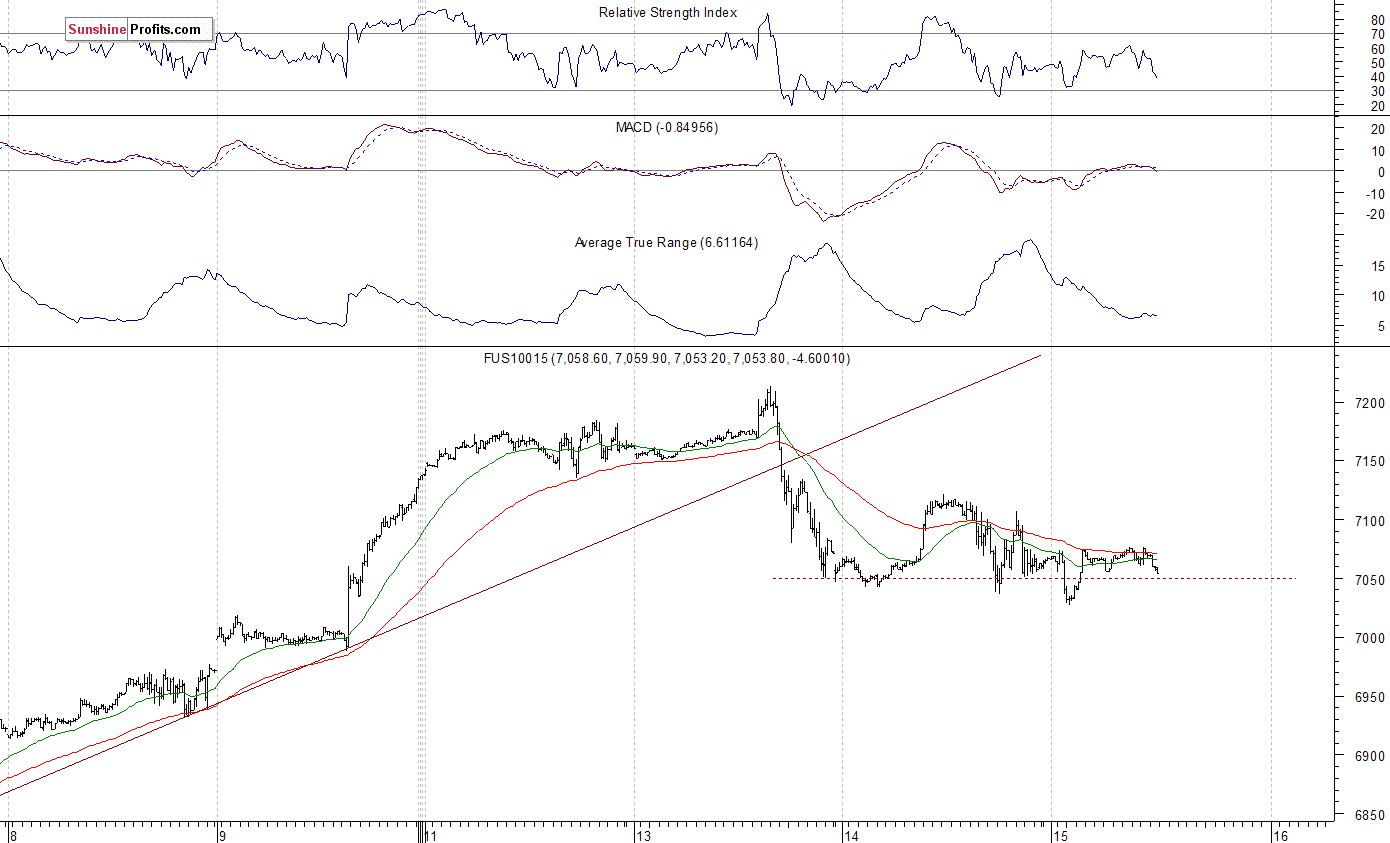
The technology Nasdaq 100 futures contract was stronger than the broad stock market recently, as it broke above 7,000 mark and continued reaching new record highs. The market gained more than 1,000 points off its February 9 bottom, as it remarkably retraced all of its late January - early February sell-off in one month. The Nasdaq futures contract was above 7,200 mark on Monday, before reversing lower and retracing most of its Friday's rally. Since then, it keeps bouncing off support level at 7,000-7,050. The Nasdaq futures contract fluctuates along that support level, as the 15-minute chart shows:
Apple, Amazon - Ugly Charts
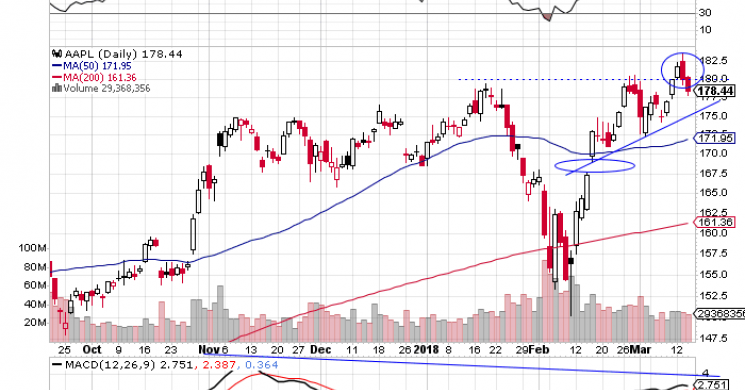
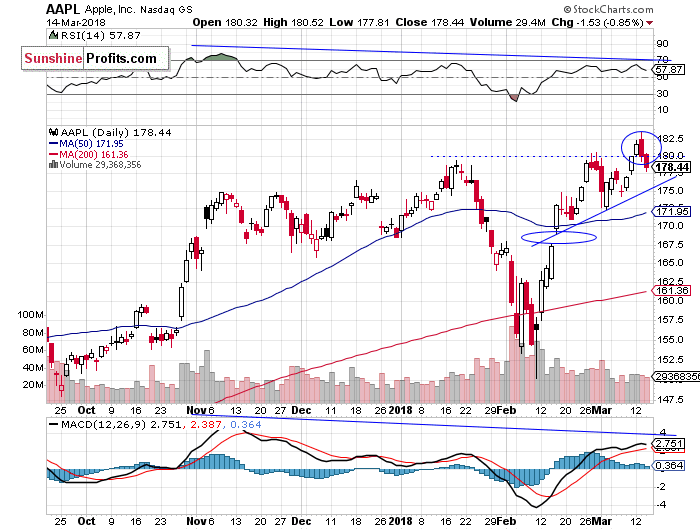
Let's take a look at Apple, Inc. stock (AAPL) daily chart (chart courtesy of http://stockcharts.com) again. It was one of February stock market rout's main drivers. Then it led broad stock market rebound rally. It fell close to support level of $150 on February 9. Since then it was retracing early February losses. The market reached new record high on Tuesday, but then it reversed its intraday uptrend and closed below $180. We can see some negative medium-term technical divergences - the most common divergences are between asset’s price and some indicator based on it (for instance the index and RSI or MACD based on the index). In this case, the divergence occurs when price forms a higher high and the indicator forms a lower high. It shows us that even though price reaches new highs, the fuel for the uptrend starts running low. On Tuesday, the marked formed a negative candlestick chart pattern called "bearish engulfing". It consists of a smaller white candlestick followed by a black candlestick that "engulfs" the white one. This downward reversal pattern has been confirmed by yesterday's move down:
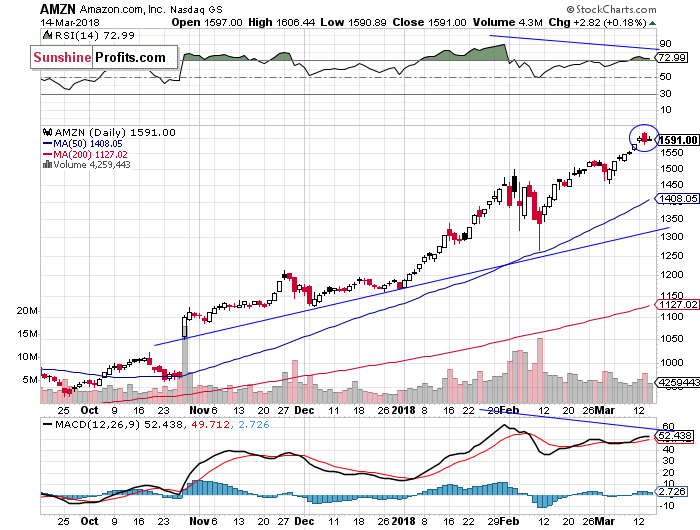
Amazon.com, Inc. stock (AMZN) continued its uptrend recently, as it reached new record high above the price of $1,600. The stock reversed its upward course on Tuesday and closed below previous day's closing price. Tuesday's trading action was bearish, as the stock formed a similar to the above-mentioned bearish engulfing pattern. However, yesterday's confirmation of the pattern was weaker than Apple's. Amazon remains relatively strong vs. the rest of the market, even stronger the other big-cap technology stocks. We still can see negative technical divergences:
Dow Jones Remains Relatively Weaker
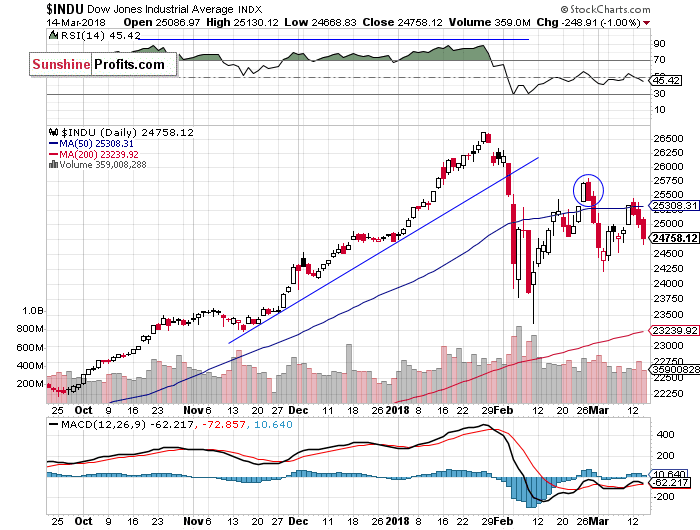
The Dow Jones Industrial Average daily chart shows that blue-chip index remains relatively weaker than the broad stock market and much weaker than record-breaking technology stocks, as it still trades well below late February local high. The market broke below 25,000 mark yesterday, as it retraced more of its recent rebound. Possible support level is at around 24,250, marked by previous local low. If the index breaks lower, it could continue towards February 9 panic low. In late February, there was a negative candlestick pattern called Dark Cloud Cover, a pattern in which the uptrend continues with a long white body, and the next day it reverses following higher open and closes below the mid-point between open and close prices of the previous day. It acted as a resistance level, as we can see on the daily chart:
Concluding, the S&P 500 index may extend its short-term fluctuations following Tuesday's bounce off resistance level at 2,800. We prefer to be out of the market today, avoiding low risk/reward ratio trades. However, if sentiment worsens considerably and the index continues lower, we would think about buying the dip (within the support level of 2,700-2,720).
The rally failed to continue following negative political news release. Was this just quick profit-taking action or more meaningful downward reversal? It's hard to say right now. Stocks are likely to open slightly higher today, but the outlook is bearish after recent rout. It seems that the overall market risk is higher than in the late February when S&P 500 was trading at the same level.
If you enjoyed the above analysis and would like to receive free follow-ups, we encourage you to sign up for our daily newsletter – it’s free and if you don’t like it, you can unsubscribe with just 2 clicks. If you sign up today, you’ll also get 7 days of free access to our premium daily Gold & Silver Trading Alerts. Sign me up!
Thank you.
Paul Rejczak Stock Trading Strategist Stock Trading Alerts Sunshine Profits - Free Stock Market Analysis
Read more by MarketSlant Editor


