
The price of gold has been feeling the pressure lately from a stronger U.S. dollar, which is at a four-month high, and rising Treasury yields. Nevertheless, the yellow metal eked out a positive March quarter, returning close to 1.3 percent, while the S&P 500 Index posted its first negative quarter since 2015. This tells me the investment case in gold and gold mining stocks remains as strong as ever.
Below are four more reasons why I think you should consider adding gold stocks to your portfolio right now.
1. Gold mining stocks look inexpensive.
Billionaire investor Warren Buffett once said: “Whether we’re talking about socks or stocks, I like buying quality merchandise when it is marked down.”
Compared to the broader equities market, gold mining stocks, as measured by the NYSE Arca Gold Miners Index, look incredibly “marked down” right now. They’re far below the average gold miners-to-S&P 500 ratio of 0.7 for the nine-year period, and nearly as undervalued as they’ve ever been.
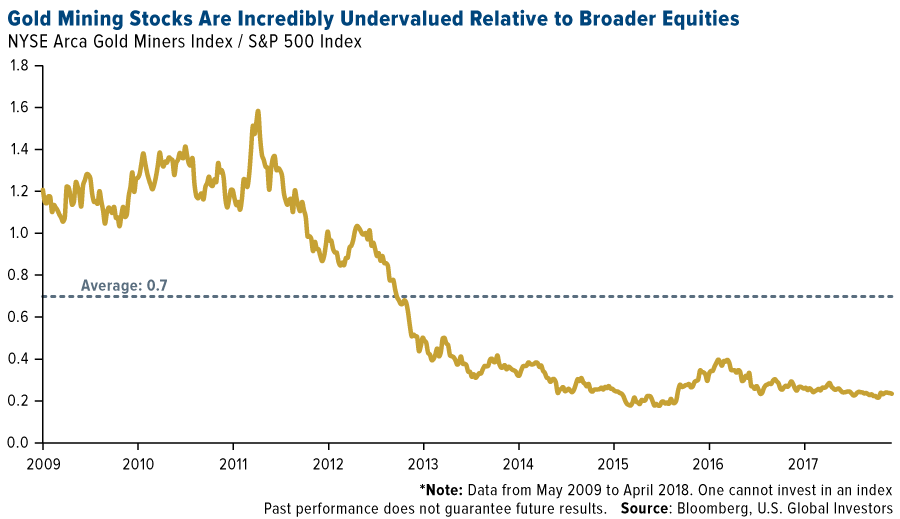
I believe that for investors with a long-term horizon, this makes gold miners look especially attractive as we await valuations to revert their mean, or average. Hopefully this can be achieved without a significant decline in the S&P.
2. Rising inflation has historically lifted gold prices.
Inflation can be understood as the destruction of wealth. Every time consumer prices head higher, a dollar loses some of its value, whether in your pocket or your savings account. Inflation can also weigh on stock prices, as some investors anticipate it cutting into corporate earnings. They might therefore decide to move their money into other assets.
That includes gold, which has enjoyed a long history of being an attractive store of value during times of higher inflation.
After being mostly stagnant for several years, inflation looks as if it’s ready to stage a strong comeback, thanks to rising oil prices and new trade tariffs imposed by the Trump administration, among other factors.
But which measure of inflation is most accurate? The Federal Reserve prefers the consumer price index (CPI), but there are others, including the New York Fed’s Underlying Inflation Gauge (UIG) and ShadowStat’s Alternative CPI.

From the chart above, we can surmise that inflation could be highly understated right now. According to the official CPI, prices rose 2.4 percent year-over-year in March. But if we use the Fed’s methodology from 1980, as ShadowStats does, it’s possible prices advanced more than 10 percent from a year ago.
Regardless of which measure you trust the most, it’s clear that inflation has been heating up at a faster pace—meaning it might be time for investors to consider adding to their gold exposure.
3. Gold supply is shrinking while demand continues to grow.
Like most hard assets, prices of gold and other precious metals respond to supply and demand. If supply goes up but there’s little demand, prices tend to struggle to gain momentum. But if the reverse happens—if supply can’t meet demand—prices have a better chance of increasing.
It’s possible we could see the latter scenario in the coming months.
That’s because many explorers and producers went into cost-cutting mode after the price of gold broke down from its record high of around $1,900 an ounce in August 2011. Exploration budgets were slashed, and partially as a result, there have been fewer and fewer large-deposit discoveries.
What this all means is that if gold demand were to spike unusually high, there’s a strong probability that not enough gold would be available. We would expect the metal to be traded at a premium.
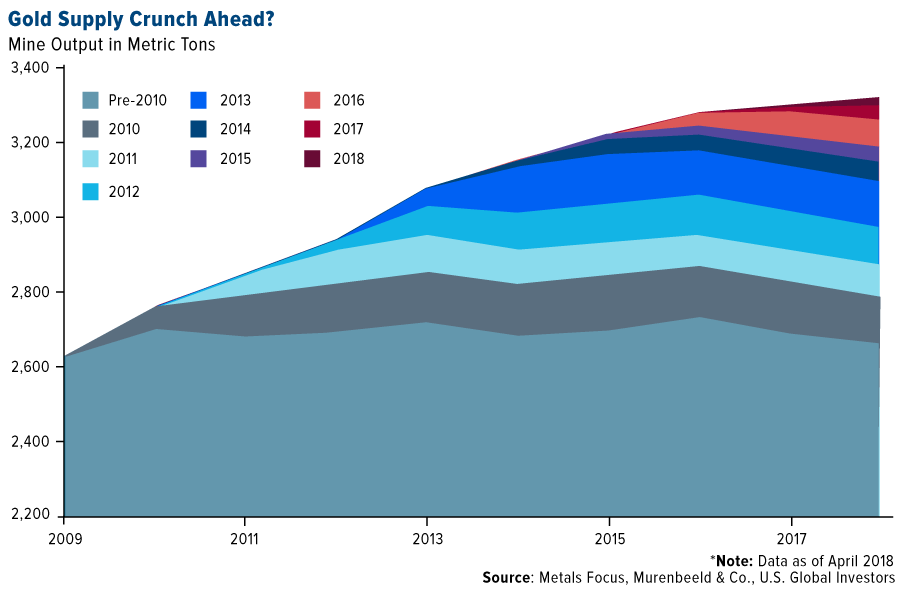
In the chart above, you can see how a smaller number of projects have been added to the pipeline in some recent years, thanks to a decrease in exploration budgets. Meanwhile, demand has continued to grow as incomes rise in emerging markets that have a strong appetite for the yellow metal—India, China and Turkey chief among them.
4. Gold prices have historically tracked government debt—which appears to be increasing dramatically.
I think what’s also driving gold demand right now are concerns over the U.S. budget deficit and ballooning government debt. The Congressional Budget Office (CBO) recently said it estimated the deficit to surge over $1 trillion in 2018 and average $1.2 trillion each subsequent year between 2019 and 2028, for a total of $12.4 trillion.
Believe it or not, servicing the interest on this debt alone is expected to exceed what the government spends on its military by 2023.
Now, the International Monetary Fund (IMF), in its April “Fiscal Monitor,” says U.S. government debt will continue to expand as a percent of gross domestic product (GDP), even surpassing levels we last saw during World War II.

This is a cause for concern, the IMF writes, because “large debt and deficits hinder governments’ ability to implement a strong fiscal policy response to support the economy in the event of a downturn.”
You can probably tell where I’m headed with all of this. Savvy investors and savers might very well see this as a sign to allocate a part of their portfolios in assets that have historically held their value well in times of economic contraction.
Gold is one such asset that’s been trusted as a store of value in such times. As I’ve shown elsewhere, gold has tracked U.S. government debt up since 1971, when President Richard Nixon ended the gold standard.
Take the Next Step
Taking all of this into consideration, I believe an excellent way to gain exposure to the gold market is with our Gold and Precious Metals Fund (USERX). USERX seeks capital appreciation and protecting against inflation and monetary instability—concerns many investors might have right now. It also pursues current income as a secondary objective.
I’m very pleased to say that as of March 31, USERX continues to hold its overall four-star rating from Morningstar among 67 Equity Precious Metals funds, based on risk-adjusted returns.
Interested in learning more about the Gold and Precious Metals Fund? Take a deeper dive by clicking here!
----------------------------------------------------------------------------------
Please consider carefully a fund’s investment objectives, risks, charges and expenses. For this and other important information, obtain a fund prospectus by visiting www.usfunds.com. Read it carefully before investing. Foreside Fund Services, LLC, Distributor. U.S. Global Investors is the investment adviser.
![]()
![]()
![]()
![]()
![]() Overall/67
Overall/67
![]()
![]()
![]()
![]() 3-Year/67
3-Year/67
![]()
![]()
![]()
![]() 5-Year/63
5-Year/63
![]()
![]()
![]()
![]() 10-Year/45
10-Year/45
Morningstar ratings based on risk-adjusted return and number of funds Category: Equity Precious Metals Through: 3/31/2018
Morningstar Ratings are based on risk-adjusted return. The Morningstar Rating for a fund is derived from a weighted-average of the performance figures associated with its three-, five- and ten-year Morningstar Rating metrics. Past performance does not guarantee future results. For each fund with at least a three-year history, Morningstar calculates a Morningstar Rating based on a Morningstar Risk-Adjusted Return measure that accounts for variation in a fund’s monthly performance (including the effects of sales charges, loads, and redemption fees), placing more emphasis on downward variations and rewarding consistent performance. The top 10% of funds in each category receive 5 stars, the next 22.5% receive 4 stars, the next 35% receive 3 stars, the next 22.5% receive 2 stars and the bottom 10% receive 1 star. (Each share class is counted as a fraction of one fund within this scale and rated separately, which may cause slight variations in the distribution percentages.)
Gold, precious metals, and precious minerals funds may be susceptible to adverse economic, political or regulatory developments due to concentrating in a single theme. The prices of gold, precious metals, and precious minerals are subject to substantial price fluctuations over short periods of time and may be affected by unpredicted international monetary and political policies. We suggest investing no more than 5% to 10% of your portfolio in these sectors.
The NYSE Arca Gold Miners Index is a modified market capitalization weighted index comprised of publicly traded companies involved primarily in the mining for gold and silver. The index benchmark value was 500.0 at the close of trading on December 20, 2002. The S&P 500 Stock Index is a widely recognized capitalization-weighted index of 500 common stock prices in U.S. companies.
The Consumer Price Index (CPI) is one of the most widely recognized price measures for tracking the price of a market basket of goods and services purchased by individuals. The weights of components are based on consumer spending patterns. The Underlying Inflation Gauge (UIG) captures sustained movements in inflation from information contained in a broad set of price, real activity, and financial data. The “prices-only” UIG is derived from a large number of disaggregated price series in the CPI, while the “full data set” measure incorporates additional macroeconomic and financial variables. The ShadowStats Alternative CPI-U Measures are attempts at adjusting reported CPI-U inflation for the impact of methodological change of recent decades designed to move the concept of the CPI away from being a measure of the cost of living needed to maintain a constant standard of living. There are two measures, where the first is based on reporting methodologies in place as of 1980, and the second is based on reporting methodologies in place as of 1990.
All opinions expressed and data provided are subject to change without notice. Some of these opinions may not be appropriate to every investor.
Read more by Frank Holmes


