I have gained an enormous amount of respect over the past couple of years for the consistently accurate technical work of Michael Oliver. I certainly do not suggest he is infallible, nor does Michael himself believe he is. But I have not personally found anyone who is more helpful to me in holding firm in my investment decisions from a longer-term perspective than Michael, which is why he is on my radio show almost every week. Michael let it be known on my radio show as gold was heading toward $1,100 that unless it dropped below $1,119 by month end he would remain solidly in the bullish camp, even though a growing chorus of technical analysts were strongly suggesting we were heading to $1,000 or below! And what if gold dropped below $1,119 by month end? In that case he would remain neutral because his longer-term indicators tell him in virtually no uncertain terms that a new gold bull market has been born. So where does that leave us now? Here is what Michael sent out to his subscribers toward the end of the trading session today.

Gold crossed it having already bumped smoothing line last week (close was at $1151). Surge this week reached $1183.80. We suspect that before this rally encounters resistance it will fully challenge the horizontal line, just above the zero line/10-wk. avg. For next week or so that suggests resistance up in the $1190-$1200 area. Ultimately if that red horizontal is bumped and generates a stall or back-off, it then becomes a major trend structure. Overcome it, perhaps after a fight, then a much larger, more potent upside signal is given by this weekly oscillator.
Note: The brief but sharp upside spike prior to and immediately after the election occurred in many markets, in one direction or the other (including in S&P500 futures - in the dark, the post-election action sold off dramatically but briefly) when much of that across market price movement was false and brief. But overall, gold shows a similar behavior of respecting the smoothing line on any first hit against it. In a second move to attack that line there is often a crossover as there was a week ago.
For now gold is positive on this intermediate indicator with MSA expecting resistance to show itself just above the 10-wk. avg. (around the red horizontal).
Michael Oliver for the Technical Analysis and Dan Oliver for the Fundamentals
There is a humility that the best technicians have because they know that collectively markets are a lot smarter than they are. But not being a technical analyst myself, I like to try to understand the reasons for market moves and I know you do too. Michael Oliver, indeed, does very well understand fundamentals underlying the technical results, though usually they become more apparent after the fact. But being able to understand macroeconomic fundamentals can, in conjunction with technical analysis, be enormously helpful, as long as one doesn’t arrogantly allow his views of fundamentals to get in the way of what is actually happening in the markets.


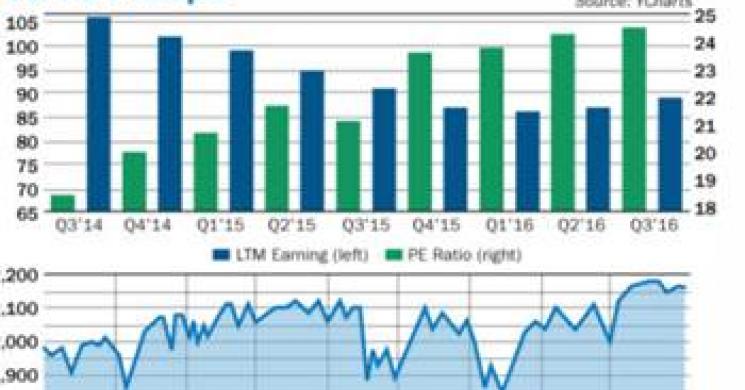
When it comes to a fundamental analysis of markets, especially the gold markets, another Oliver, namely Daniel Oliver (not related to Michael), takes second place to no one. Please cast your eyes to the charts above, which are from Daniel Oliver’s “Myrmikan Research Update,” dated October 24, 2016.
Mainstream propaganda born out of Keynesian lies may try to convince you that budget deficits don’t matter. But Dan provides significant evidence that is certainly not the case. First note the chart upper left that displays year-over-year rate of increases in budget deficits. As you can see, it appears that the rate of federal debt growth is bottoming out at this point in time.
Despite the propaganda from the mainstream, even a much less delusional Federal Reserve understood that budget deficits lead to inflation of commodities. In a 1947 Fed publication the Board of Governors titled, “The Federal Reserve System: Its Purposes and Functions,” stated the following:
When an individual or a corporation pays taxes or buys a Government bond, the Treasury comes into possession of money that was already in existence and owned by the taxpayer or bond purchaser. There is no addition to the money supply and no additional upward pressure on prices . . . When, however, a bond is bought by the banking system, no one gives up his money to the Government; new money is created in the form of a bank deposit to the credit of the Government. As the Government spends this money . . . it results in an upward pressure on prices.
Of course! This makes perfect sense. No matter what the interest rate, additional federal debt pumped into the system causes prices to rise. But when rates rise, prices really take off big time!
Now, cast your eyes to the chart above right. Dan Oliver used Federal Reserve Bank data to demonstrate that this analysis is correct. He ran a multiple linear regression analysis of the price of gold (lagged 250 days) against the square of federal debt outstanding and the square of the nominal 10-year Treasury bond yield. The model explained that from 1971 when Nixon closed the gold window until 2013, the rate of U.S. federal debt growth explained 94% of the movement in the price of gold!

So what happened in 2013 to cause this longstanding relationship between government deficits and gold to break down? I believe there are a couple of factors.
First, the Fed has responded by massive money printing every time the stock markets tried to sell down, and indeed I believe (but have no direct evidence) that the Presidents Working Group may well have entered the markets at key times to purchase indexes in the futures markets to keep the markets from naturally melting down, as they most assuredly would have if they were free to do so. That has resulted in the longest running bull market in stocks on record and one of the most overvalued stock markets in history, as can be seen from the stock shown on your left from a recent article written by David Stockman. This market manipulation by the Fed has kept people into stocks and out of gold.
But Daniel’s explanation may be the most important reason especially now that interest rates are rising and doing so at a time when the global economy can’t stand rising rates. As Daniel points out, the largest loans globally are denominated in dollars. Thus when economic growth sputters and the margin clerks call for repayment of those loans, debtors are forced to sell assets and buy dollars, thus making the dollar appear to be strong. But that is not a good reason for the strong dollar. Indeed, what is happening now is a reversal of credit expansion in the global economy on a secular scale, which is the fundamental reason I believe Michael Oliver’s technical models are showing that we are at the end of a 40+ year bull market in U.S. Treasuries. This is indeed reminiscent of the 1930s setting off a trade war, which does seem to be a growing prospect given rising tensions between Trump and China. On the other hand, Trump wants to spend huge amounts of money for fiscal stimulus on infrastructure, rebuild the military, the wall with Mexico, and a host of other goodies. The main point to realize is that whether we are heading toward a deflationary depression or an inflationary depression, global growth is in decline (as per the IMF) and the credit cycle is over. From a longer-term perspective, gold and gold shares do very well when credit contracts and they do poorly when credit expands. There is every reason to believe from a fundamental point of view that gold is setting for a massive bull market in real terms. The only question is what the nominal price of gold will be, but I firmly believe it will be much higher in the years to come, starting with this year. And so far, the work of Michael Oliver seems to confirm that viewpoint, which I share with Dan .
Jay Taylorwww.jaytaylormedia.com www.miningstocks.com
Read more by jaytaylor


