Summary
This weekend the G20 met and gave anecdotal evidence that King Dollar will be dethroned sometime in the next 10 years. The USD came out of the meeting softer and Gold stronger. The winners from our point of view at the summit were Russia and China. The losers were the US and UK. As tea leave readers the events will long be forgotten in the next news cycle, but they are the slow inevitable drivers behind the replacement of the USD as global currency by an SDR which will likely contain hard assets in its basket of currencies. Meanwhile Central Banks keep buying Gold at varying paces. But this is about Technical Analysis. -Soren K.
A Brief Digression: We are currently going through the JPMorgan 13F with an eye on why in heaven's name they have or control so much Silver. Simultaneously, on the back of the recent Deutsche Bank failure to deliver Gold on the Xetra ETF, we are researching the mechanics of confiscation. And there is a huge intersection between JPM's Silver and the prospects of Gold not being available to the public in the future. We are also reading Peter Bernstein's old stuff on Gold's value and why it is money when Silver is not. We were looking at it as a short term trade. But are slowly concluding that we must own more Silver as a speculative investment. Conjecture so far. But not invalidated it yet. More on that tomorrow
On Manipulated Markets
Gold Technicals
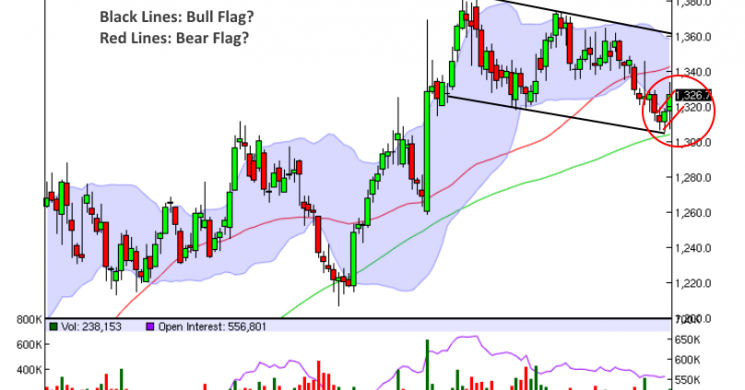
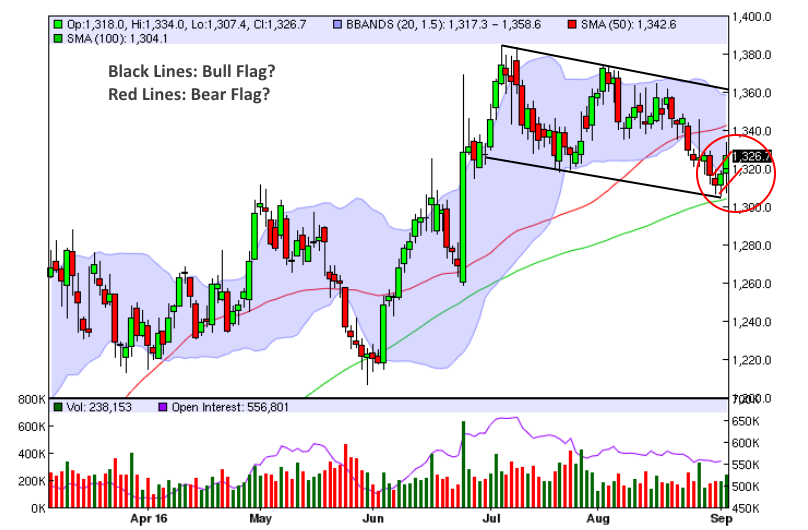
- Bear Flag or Double Bottom?: We noted in previous reports that the circled area represents either a bear flag or a double bottom. These are not mutually exclusive. And today's activity makes the bear flag case hard pressed to use as rationale.
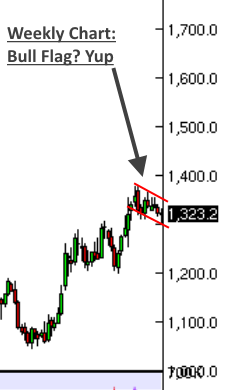
- Bull Flag: There are those who would describe the black channel as a Bull flag. We disagree as it is too long to be a flag on a daily chart for our taste. However on a weekly chart it looks more so. This is where Elliott Wave and Fibonacci retracements mean more to the long term trader.
Gold Daily: Double Bottoms, Bear Flags and Long Channels
interactive chart HERE
Recently:The G20 Photo-Op Says A LotOil Report: Break under $40 in the CardsInsider's Walkthrough on Trump, Fed Alchemy, Gold, Silver, and Debt
Weekly Gold: This is a Bull Flag.
Elliott Wave Analysis:
Avi Gilburt of Elliottwavetrader.net provides a forward looking perspective that is quite helpful due to its plain spoken translation of what could happen in Gold as a function of GDX and GLD as well as Silver. . Emphasis ours
FTA: Sentiment Speaks: Will A Surprise News Event Cause Our Market To Crash Next Week?
... I will simply say that we have not developed a strong bottoming signal to suggest we are heading to higher highs just yet. But as long as we remain over 26.80 in the GDX, 125.40 in the GLD, and 19.05 in silver in the upcoming week, we can develop that initial 5-wave structure (towards the 28.50 region in the GDX) to suggest much higher highs are to come.
How We Play these Formations
Bearish forces are still at work. We expect sellers of weakness to come in hard on a penetration of the double bottom, and with it the 100 DMA. If the weekly Bull flag breaks the top line, expect an opportunity to buy on a pull back to the top of the flag. It happens a lot. The trades lining up are:
Bullish Trades
- Bull Flag Break- The "safe" Bull trade is to wait for the Bull flag to break on a weekly close. Then buy the next week on any pull backs to the channel top.- Patient, macro trade. Will challenge risk/reward metrics.
- Double Bottom Buy in- The more aggressive trade is to use the daily chart and buy here looking at the double bottom area as your stop out.- there may be pain on way to a decent target of $1380
- Let Them Sell the Hole- The momentum trade is to hope for a test and penetration of the double bottom. Hope the momo sellers come in. Then look for the new daily low tonot be corroborated by the RSI.- Great risk reward. Stop outs likely. Be ready to put it on and get stopped out multiple times (like Tudor does). Might not happen. But would fit nicely in the EW analysis above.
Bearish Trades: Easy. Look at every trade above and do its opposite on failure to confirm. Aside from that, Also fits nicely in the EW analysis above.
- Bear Flag Redux- Assume the daily is a bear flag: Treat a reentry into the bearflag as a failed breakout. Stop out at previous day's high
- Bear Flag Break- Sell a break of the bear flag's lower level- watch for behaviour at the DBL bottom
- 4th time down is the charm- Sell into a triple bottom if one occurs. A Triple bottom is a double bottom that has NOT been broken but has been tested. This makes it a triple bottom. and "triple bottoms are made to be broken". The almost never hold on a 4th time down. Sell the bounce or sell the 4th time down
Expressed in Options:
Bull
-Short an unhedged P.S. long a Call (3 way)
-Long a hedged put spread
Bear
-Long an unhedged P.S. short a call (3 way)
- Long a hedged C.S.
DEC GOLD Resist: 132190, 133060*, 134150* ST Trend: Down(131710) Supprt: 1308-, 1300+/-, 1290 Obj: 129290 TRP: 1342.00Comment: The market remains in a downturn and retains a chance to wash below 1300-. Correctivecongestion should stay under 133060* to maintain aggressive bear forces. A close over 133060* signals forstronger rebounds, but a close over 134150* is the key for a reversing turnaround. A close under 1308 willencourage follow through selloffs and reinforce ideas for a break below 1300-.
Silver Technicals
We like Silver. Not just as a trade, but as a thing of mystery. We've charted its correlations to Copper and Gold. We've tried to isolate its industrial component to its precious component. We've created synthetic contango' with options. We've taken delivery to arb the big dumb rollover by funds. We've done Copper trades based on the Gold/ Silver ratio, Gold trades based on the Copper/ Silver ratio. All with some success. But never enough to take us away form our love of volatility arbitrage. All of them were Regression to the Mean (RTM) trades. For a gray pet rock, Silver is remarkably hard to pin down. But we think we are getting its number now. We love silver. And you should know that when we start telling you we are bullish. That is a Red Flag of our bias.
Time to Add Tools
In a previous post we noted it is our goal to start showing other tools we use to form opinions. Normally we hesitate b/c of their subjectivity. Adn frankly we don't want to start alienating readers by looking like flip-floppers. But the requests for longer term outlooks are coming in. And with the nonsense banks put out as projections we want to enter the fray with our own projections.
Part of this is in trying new products. On that note we have found several products that we sorely want to include in our tool kit. Most are cycle based and longer term. We feel this would be most helpful to readers looking for some better handle on longer term perspectives than our Fibonacci retracement numbers.
We use programs that embody our option-centric approach to probabilities in commodities movement. We are in the education stages right now on a couple new tools. Essentially we see them as a way to better see how/when smart money is exiting. In Silver one says the likelihood of continued rally is high. Until we can properly understand the software and how it complements our own tools, we will just put up a chart. It is quite easy to use, but we want to see how it handles our subjective inputs. That said it has been insanely accurate in Silver from as far back as Brexit, not using our inputs
Silver: Odds are in favor of a Rally
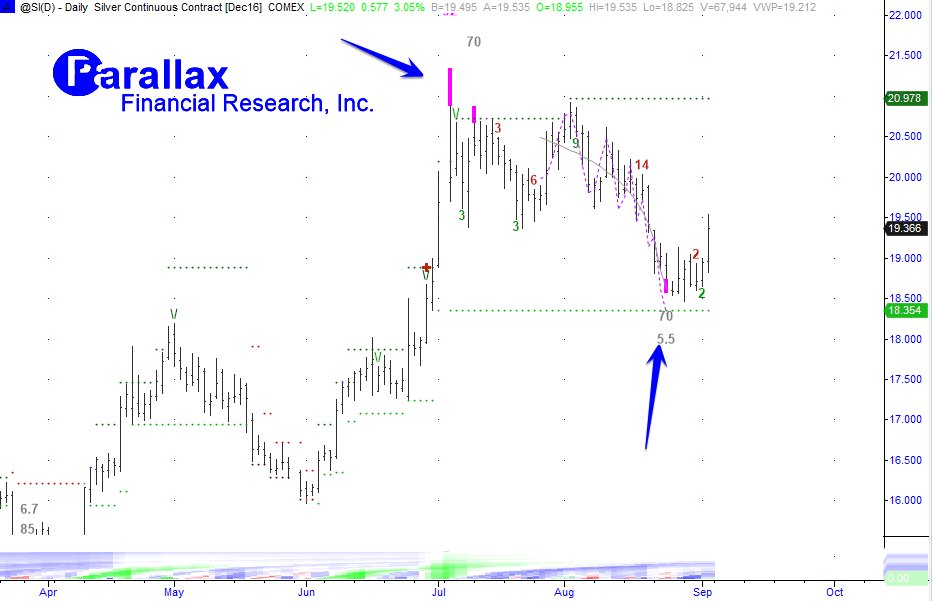
How to read the above from our own understanding:
- Pink are end of trend markets, blue are new trend markers.- refers to pink and blue bars in arrows
- The colors at the bottom ar every helpful as "probability clouds" to us. - more on that later
- The concepts are tied to where equilibrium is for a product. How the pendulum will swing the other way given a move one way.
- Right now we believe it is saying, Silver has a 70% likely to rise or go sideways presently
DEC SILVER Resist: 19105, 19385-1940* ST Trend: Down(18955) Supprt: 18495, 18375, 1811- Obj: 1811 TRP: 1940.0Comment: The market is in a downturn and a close under 18375 could add a wash along 1811-. Anyadditional rebounds or corrective congestion will likely stall inside Friday’s range and use sidewayscongestion to bear flag and setup for selloffs. A pop over 1914 is near term friendly. However, only a closeover 1940* triggers a reversing turnaround.Caveat: No product discussed here is compensating us or us them for their technology or opinion. If we do pay for the software discussed, it is because we use it as traders. Any product is only as good as the input used. All models are a "candle in the darkness". Any product that claims it is a flashlight of certainty is lying or owned by th FOMC.
Previous Technical Reports
Good Luck
Soren K
Read more by Soren K.Group


