Article originally posted October 10th. Latest update November 2nd.- Soren K.
S&P Technical Update: Nov 2, 2016- Stocks Have Worst Losing Streak in 5 Years
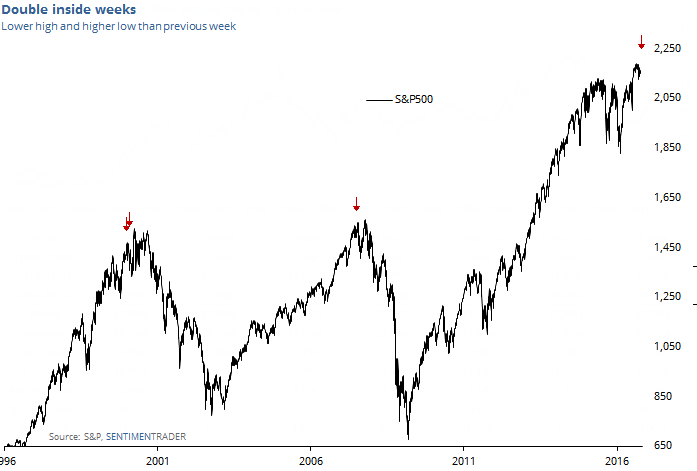
Original Alert- Double inside weeks
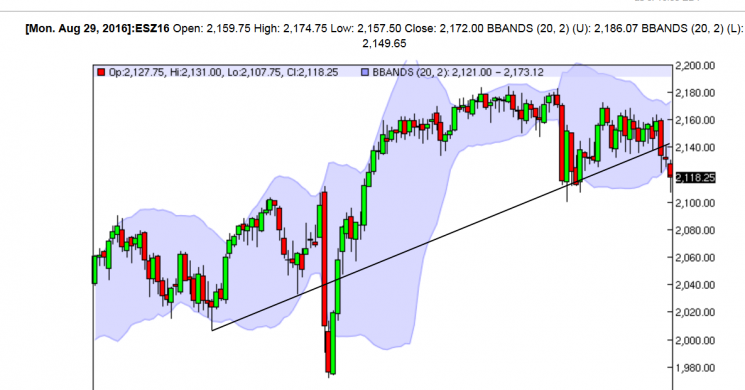
Original Technicals- 10/10
Trend line broken yesterday, weakness continues
Under 2147 (Fibonacci Pivot) > 2128
Under 2128> 2093
Domed House in play
Nov 2 Activity
- S&P 500 closes under 2100 for first time since July 7th.
- In the process, it hits our target of 2092.
- the Domed House concept has not played out yet
- The Fed did not raise rates and stocks sold off.
Pot Odds- Nov 2
It is beginning to look a lot like the unintended consequences are engulfing the desired ones when it comes to Fed market mastery. The complexity of the market situation is not unlike trying to keep a person overdosed on heroine and cocaine balanced with sleeping pills and coffee. And we are now beyond the concept of diminished returns on Fed intervention. The Fed has passed into no man's land with negative real rates. We are too far in to take our medicine now. Like it or not, we are married to the Fed, and the pot odds dictate them going all in soon. But not until Clinton wins. If she does not, Trump will inflate but not using monetary policy. He will build, whether we need it or not. His play will be fiscal spending
Chart- Nov 2
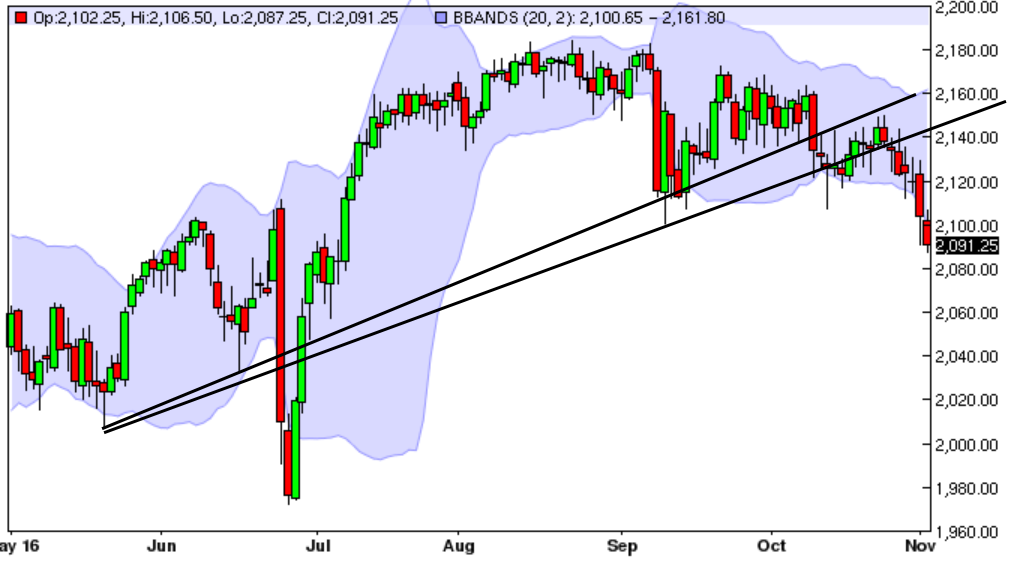
Technical Update- Nov 2
Market reached our objective. We should see bear-flagging sideways action for a couple days below 2127 prior to another sell-off.
Fibonacci Reversal: 2127
Support/ Resistance
- 2053**
- 2078
- 2085
- 2092
- 2121
- 2127**
- 2147
Gold Technical Update- Nov 2nd

interactive chart here
The MOMO boys have the baton and are now going to buy strength and sell weakness. Volatility will increase. We've been calling for a rally to $1300 since Oct 6th. Tables have been pounded, phones have been broken, duct-taped and broken again. From here we think it very smart to peel back profits, or at least trail stops. The next level of significance is $1307-$1309. Start to watch OI. If it goes up, that is ok. If it goes up on new highs but RSI does not make new highs, then be careful. That is what happened on the lows
Technicals
Fibonacci Pivot: 1308
- 1325
- 1315
- 1308*
- 1303
- 1298
- 1289*
- 1278
Now What?
- Long from the $1250 area- we would take profits on half and put a stop loss on the other half beneath
- Long from the VBS level of $1278-1289- close all of it. You've risked 1 to make 2. Book it
- If still want long exposure- buy small delta call spreads as you sell futures
Gold Doesn't Care Who the President is
It does not matter who is President. All "things" are going up as a function of inflation. Under Trump we agree with Alchemist the rally will be relatively orderly in a 1970's type play. We'd be long gold and short calls as a dividend. If Clinton wins, it will more likely move higher in "fits and starts" as it has for the last 3 years. Continued Fed policies will encourage financial asset inflation and Gold will be left behind. But crises will happen and denial balloons will pop. We'd be long less Gold and trade around it, buying on dips and selling on rallies while keeping a core position.
Daily Digest- Nov 2
Markets
- Why Gold Will Be Almost Worthless- [Archived]
- Trump or Clinton: The Difference is HOW Gold Will Rise
- Gold up 22%, Stocks up 3%, BOJ Surrenders
- ADP Reaction in 5 Charts- Gold, Peso, and the Polls
Election
- Nov 1 Leaks: Podesta is a Blockhead
- Putin Shrugs at US Election, Mixes Polonium Cocktails
- Worst DNC Email Leaks for Oct 31
Be Well
Original Post- Oct 10
Stocks Are Weak- updated, Oct 13th
- Tuesday's S&P 500 selloff was a technical trigger
- Past performance is not good given our current situation
Gold
The trade is still good, with reversal levels
Stocks
Take your pick
- Hillary's a lock, so the Fed can raise.
- QE is over and tapering will be successful!
- Funds are liquidating world wide due to no profits and scandals
- Brexit is the death of the EU
- No one left to buy except retail- our personal favorite
The Technicals
Trend line broken yesterday, weakness continues
Under 2147 (Fibonacci Pivot) > 2128
Under 2128> 2093
Domed House in play
Double Inside Weeks are Bad
And We are Coming Out of One Now
The Domed House Formation Revisited
We pointed this classic, arcane formation last month. To refresh:
FTA:
The technical formation called "Three Peaks and a Domed House" is potentially signaling a serious top in the stock market. It is a complicated pattern and as a result appears infrequently. It is also true that complex patterns work less often than fans expect.
As a result, of its outrageous complexity not too many people take the pattern seriously. but perhaps if they looked at it more as a combination of 2 separate patterns, that would change. In this case a triple-top breakout followed by a rounded top failure. Looking at it that way, applying it to the S&P you might be more inclined to pay attention. Full description in our previous post
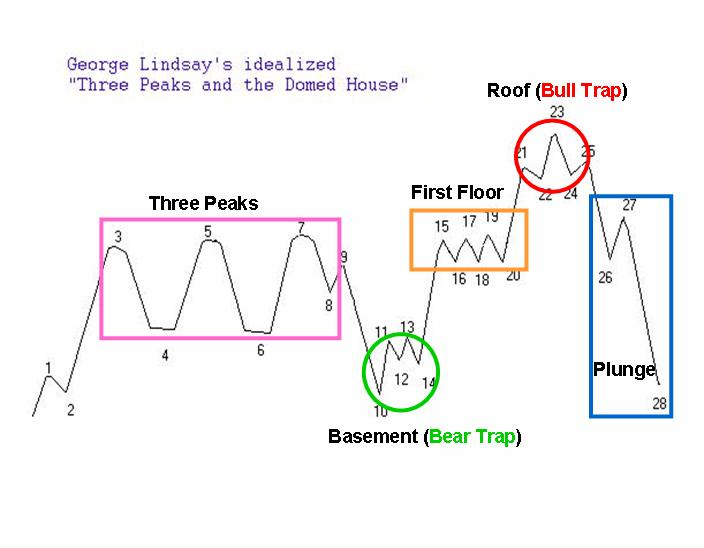
The point is, the Domed House is still in play. It is grown a bit, but to us that makes it look all the more fragile.
Updated Nov 2

Good Luck
Read more by Soren K.Group


